Marc Chandler
My articles My offerMy siteAbout meMy videosMy books
Follow on:LinkedINTwitterSeeking AlphaAmazon
George Dorgan
My articles My siteAbout meMy videosMy books
Follow on:LinkedINTwitterSeeking Alpha
CFA SocietyEconomicBlogs
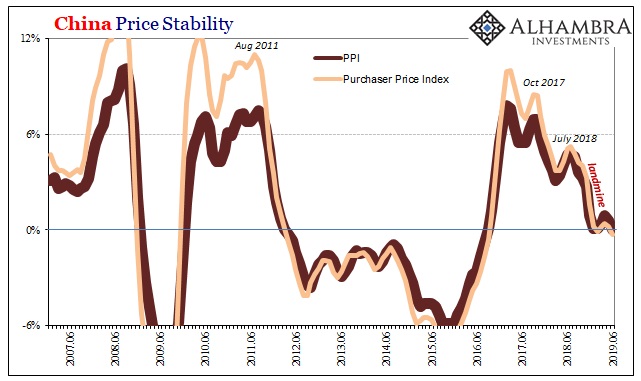
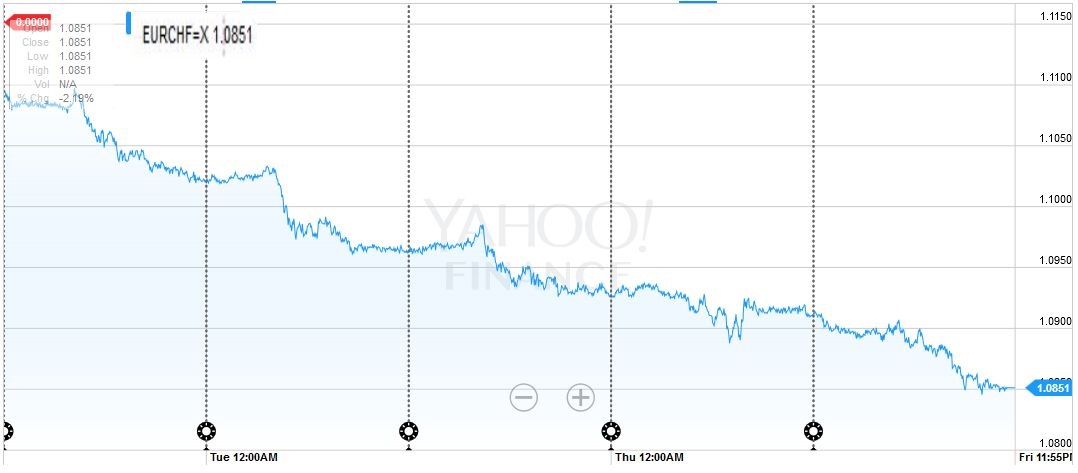
EUR/CHFThe SNB has about 280 billion CHF in euro. Hence the loss of 2% in the EUR/CHF rate will cost the SNB around 14 billion Swiss francs. |
FX Rates June 06 to June 10, 2016
|
USD/CHFAs Marc explains, the dollar recovered a bit in the second part of the week. Still enough so that the SNB lost 10 billion on the dollar positions during the week.
|
 click to enlarge click to enlarge |
Continued by Marc Chandler
Although four central banks meet and there are numerous economic reports, there are two main events that will drive the foreign exchange market. The first is the FOMC meeting.
The shockingly weak job growth dashed whatever lingering odds of a move next week. The key then is not what the Fed does but what it says. How much does the Fed keep the July meeting alive? Does it back away from the two rate hikes the median official dot plot suggested was appropriate in March?
EUR/USD
The US dollar traded heavily in the first few days of last week as investors continued to respond to the poor employment report. However, Yellen’s willingness to defer judgment, while noting the underlying economic strength, JOLTS and the initial jobless claims, coupled with the ongoing anxiety over the June 23 UK referendum helped the dollar recover in the second half of the week. The euro recorded a reversal pattern on The 20-day moving average is found comes in around $1.1240. Also, the trendline drawn from the early December low etched by disappointment that what the ECB delivered was not what Draghi’s rhetoric indicated, through the early-March lows, and catching the recent lows. It is found near $1.1165 by the end of next week.
The Dollar Index rallied from May 3 to May 30. It then fell, and sharply after the jobs disappointment. Through June 9, it retraced 61.8% of May’s rally. The gains in the final two sessions of last week allowed the Dollar Index to recoup 38.2% of the recent leg lower and brought it back to its 50 -day moving average (~94.45) The 50% and 61.8% retracements are found at 94.70 and 95.00 respectively. The 20-day moving average is found near 94.95. The strong close before the weekend, the constructive RSI, with the MACDs about to cross higher favor follow through buying at the start of the week.
|
FX Rates June 06 to June 10, 2016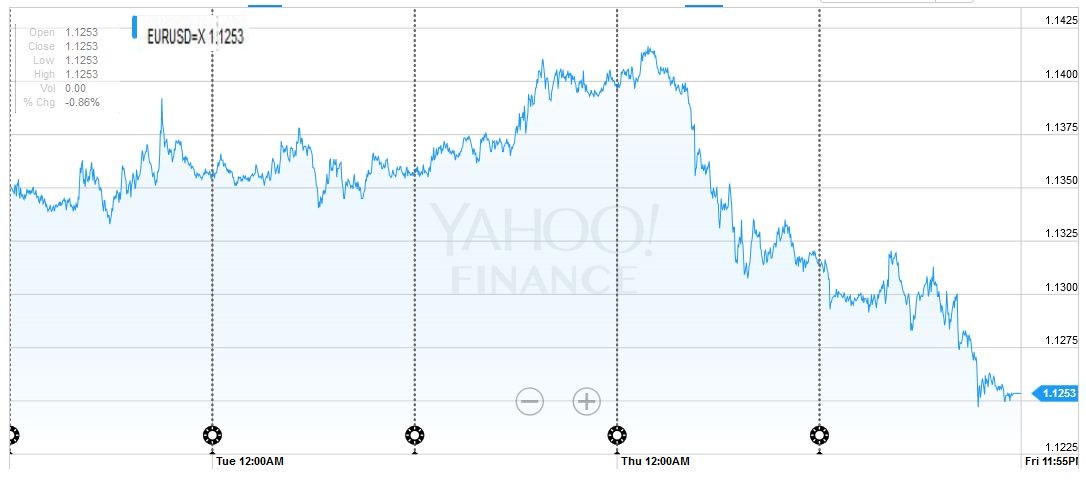 click to enlarge
|
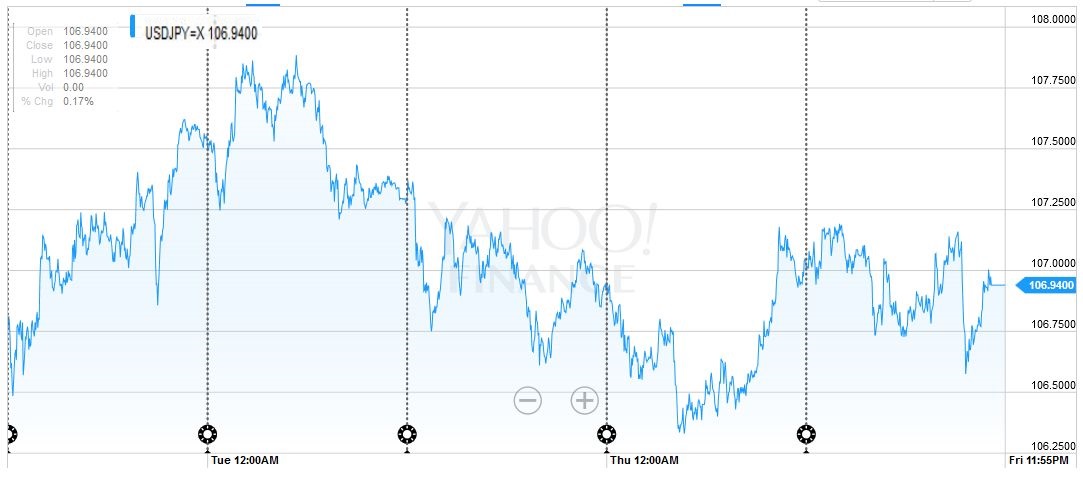
USD/JPY
The dollar did not trend against the yen in the past week. It moved broadly sideways within a relatively narrow range. The JPY106.40 to JPY107.40 captured the bulk of price action. The technical indicators we use are not generating a strong signal. Many fund managers in Japan are anticipating further strength in the yen. Few, if any, look for a BOJ move this week. The dollar appeared resilient against the yen before the weekend despite the drop in stocks and US bond yields. While the dollar has corrected higher against the other major currencies, it has found little traction. The 38.2% retracement of the drop from May 30 to May 9 is found near JPY108.25. A move toward there may be met with new sales. Official public guidance matches our private impression. While many officials may prefer a weaker yen, volatility can be the only justification for intervention. If the yen gradually strengthens, Japanese officials have few tools to use. A break of the JPY105.50 area seen in early-May could be an inflection point, suggesting a move toward JPY100 and higher volatility.
|
|
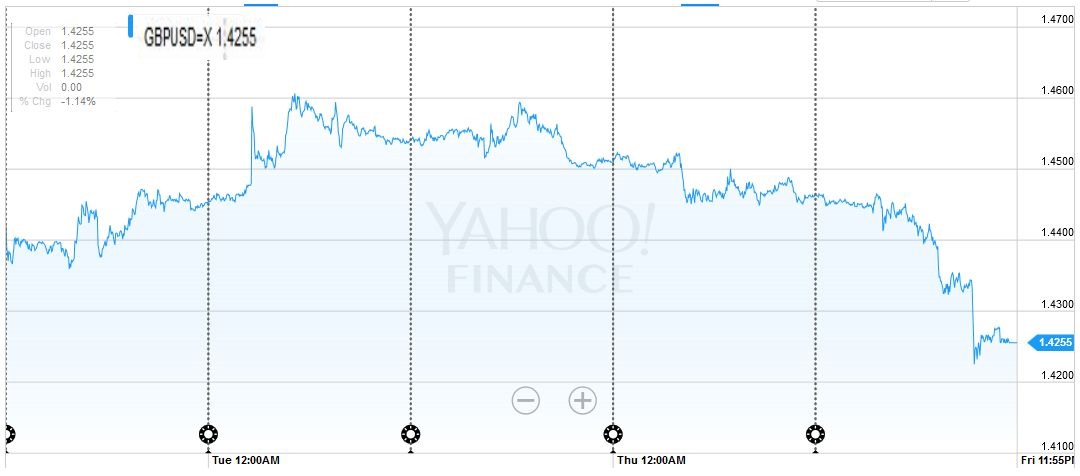
GBP/USD and Brexit
|
 |
USD/CADCanada reported healthy jobs data, better than the market expected, but it was not enough to push the US dollar below $1.2650 area. This added to the sense that the greenback has built a shelf there and is likely to correct higher. Oil prices had already lost some of the earlier upside momentum and slipped further on news of a second week that the US rig count rose. A convincing move above CAD1.2770 targets CAD1.2840, but provided the CAD1.2650 level remains intact; we suspect the US dollar can head higher. |
 |
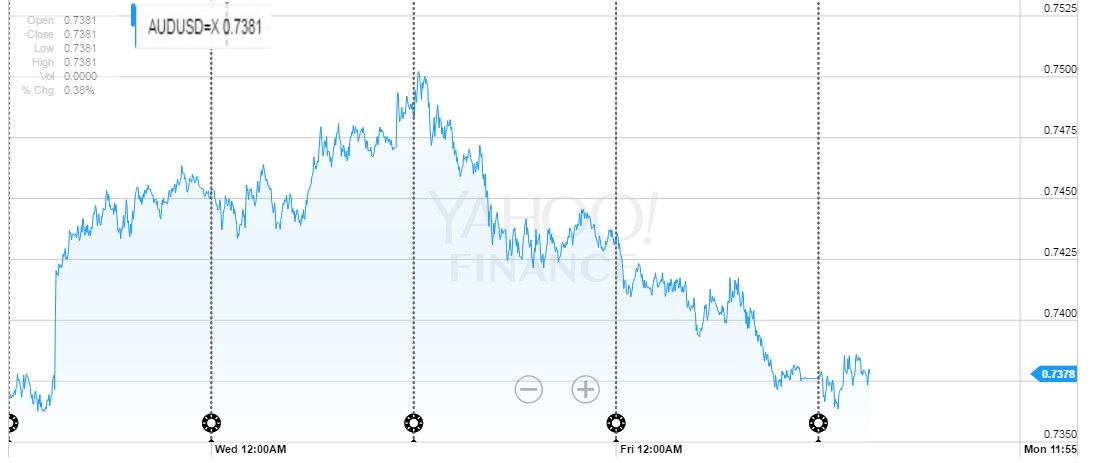
AUD/USDThe Australian dollar rallied 2% to probe our $0.7500 target by June 9, helped by a central bank that seemed in no hurry to give the market the rate cut it expects. However, after making new highs for the move (best in a month), the Aussie reversed lower and finished below the previous day’s low. There was follow through selling before the weekend. The $0.7365 area that was approached corresponds to a 38.2% retracement of the Aussie’s updraft since May 25 low near $0.7150. The $0.7325 is a 50% retracement, and them 61.8% retracement is found at $0.7285.
|
 |
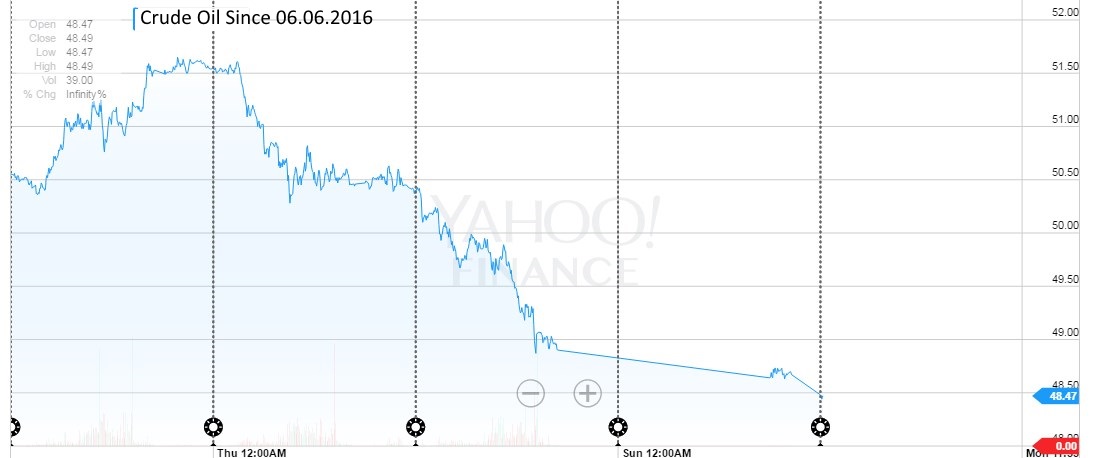
OilThe July crude oil contract did not have a textbook reversal pattern on June 9. Though it traded on both sides of the previous days range, it did not close below the previous day’s low. However, there was follow through selling on June 10 before the weekend. The price action appears to be signalling the start of a corrective or consolidative phase. The RSI has turned down. There is a bearish divergence in the MACDs. The July contract closed below its 20-day moving average (~$49.10) for the only the second time since early-April. Support is seen near $47.25-$47.50. A break of that band would signal a downside correction rather than consolidation. Initially, there would be scope for a move back into the $44-$45 area.
|
Prices June 06 to June 10, 2016
|
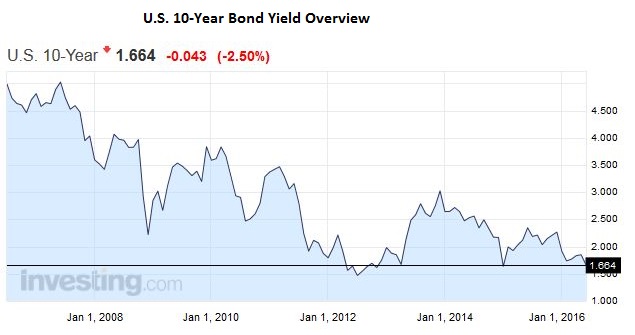
BondsThe US 10-year yield fell seven bp last week. This did not reflect, at least looking at the 10-year breakevens a decline in inflation expectations. The move took place in the last two sessions of the week and coincided with the dollar’s recovery. The main driver seemed to lay outside the US. German, British, and Japanese yields fell to record lows. Negative yields in Europe and Japan, including on some corporate bonds (in Europe and a zero-coupon issue by a Japanese company) encourage demand for the high-yielding (and sometimes, less risky) US bonds. The 10-year yield sunk to 1.63% in late turnover before the weekend, the lowest rate in three years.
|
 |
|
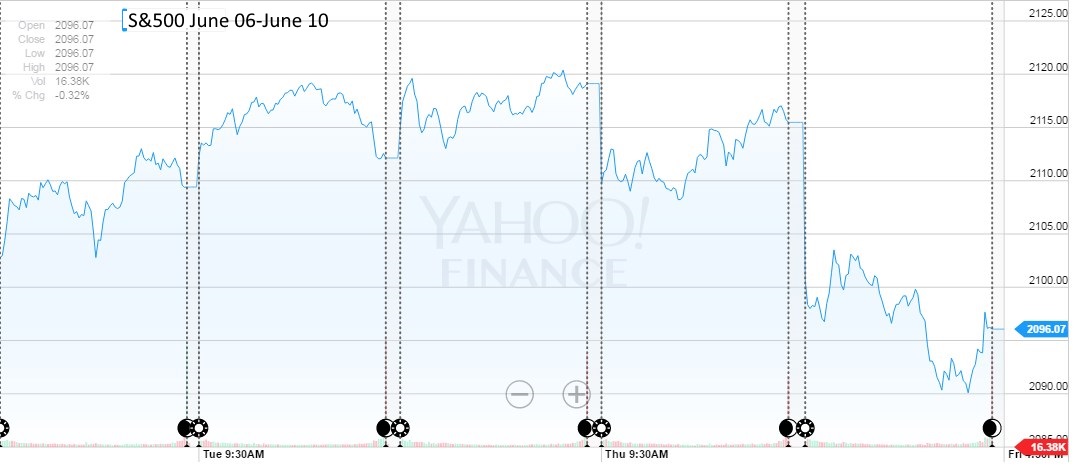
The S&P 500 looks heavy. It was flat on the week, but offset in the last two sessions everything it made in the previous three. The rally in bonds and the dollar, firmness of the Swiss franc and yen, and weak tone of emerging markets and equities in the last two sessions seems to reflect a risk-off mindset. The 2082-2085 in the S&P 500 is important technically.It houses a retracement objective from the leg-up that began May 19, the 20-day moving average and some lows and highs from recent weeks. The RSI turned lower, and the MACDs are crossing to the downside. It may require a break of 2025 to signal anything of significance. |
 |
Originally Posted by Marc Chandler on Marc to Markets, Charts and CHF data added by George Dorgan and the snbchf team
Are you the author?Tags: Janet Yellen,newslettersent,U.S. Initial Jobless Claims,usd-jpy