Marc Chandler
My articles My offerMy siteAbout meMy videosMy books
Follow on:LinkedINTwitterSeeking AlphaAmazon
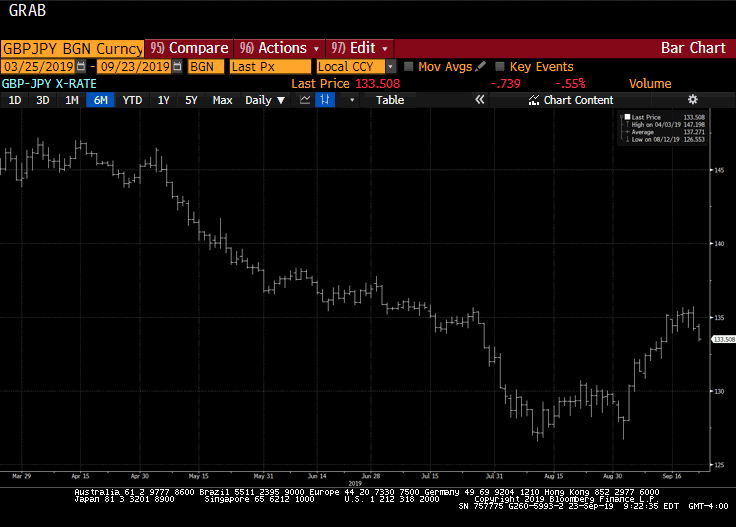
 We have been looking for a bottom in the US dollar against the Canadian dollar. It is been difficult, but now it appears that the technicals are turning. This Great Graphic, from Bloomberg, shows that the US dollar is moving above a trend line down off the January 20 high just below CAD1.47.
The downtrend line connects the late February high and the mid-March high. It intersects today near CAD1.3200. The 20-day moving average, the green line, also caught the February and mid-March high. It comes in today near CAD1.3200. A close above CAD1.33 would be constructive, but the CAD1.3400-CAD1.3460 area is more important.
Oil prices bottomed the same day the greenback peaked against the Canadian dollar. Oil prices put in a high on March 18, the same day the US dollar put in its low against the Canadian dollar. Oil prices. Oil looks heavy and the MACDs have cross lower. A break of $37.70 basis the May light sweet crude contract would lend credence for the negative near-term outlook.
The US premium over Canada for two-year money has moved off the 23 bp low from last month, but near 31 bp now it is still arguably too low to give the greenback much of a lift. However, prospects of a Q2 Fed hike may be helped by a strong employment report next week.
Full story here
Are you the author?
We have been looking for a bottom in the US dollar against the Canadian dollar. It is been difficult, but now it appears that the technicals are turning. This Great Graphic, from Bloomberg, shows that the US dollar is moving above a trend line down off the January 20 high just below CAD1.47.
The downtrend line connects the late February high and the mid-March high. It intersects today near CAD1.3200. The 20-day moving average, the green line, also caught the February and mid-March high. It comes in today near CAD1.3200. A close above CAD1.33 would be constructive, but the CAD1.3400-CAD1.3460 area is more important.
Oil prices bottomed the same day the greenback peaked against the Canadian dollar. Oil prices put in a high on March 18, the same day the US dollar put in its low against the Canadian dollar. Oil prices. Oil looks heavy and the MACDs have cross lower. A break of $37.70 basis the May light sweet crude contract would lend credence for the negative near-term outlook.
The US premium over Canada for two-year money has moved off the 23 bp low from last month, but near 31 bp now it is still arguably too low to give the greenback much of a lift. However, prospects of a Q2 Fed hike may be helped by a strong employment report next week.
Full story here
Are you the author?
He has been covering the global capital markets in one fashion or another for more than 30 years, working at economic consulting firms and global investment banks. After 14 years as the global head of currency strategy for Brown Brothers Harriman, Chandler joined Bannockburn Global Forex, as a managing partner and chief markets strategist as of October 1, 2018.
Tags: Great Graphic