Marc Chandler
My articles My offerMy siteAbout meMy videosMy books
Follow on:LinkedINTwitterSeeking AlphaAmazon
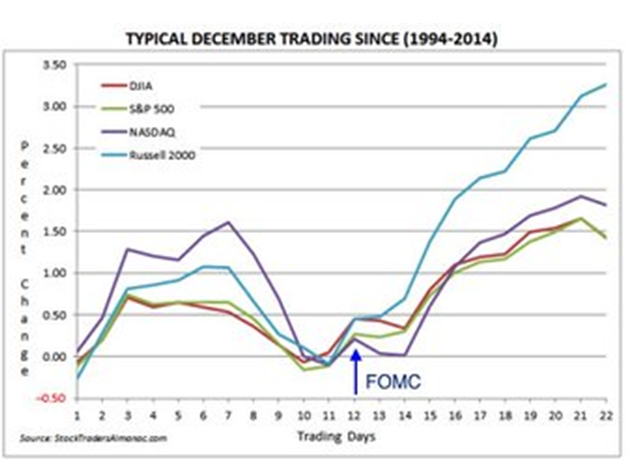
This Great Graphic shows how different measures of US equities perform in December by day for the past 20 years. I got it as a tweet from Urban Carmel, who got it from the Stock Almanac.
Today is eleventh session of the month. Equities typically rallied starting now in December. Since 1994, the S&P 500 has fallen in the month of December five times (1996, 2002, 2005, 2007, and 2014). Since 1994, seasonally, December is one of the best months for S&P 500 in terms of number of times since 1994 that it posted a monthly gain. April matches it for number of monthly increases since 1994.
In the three years of falling S&P 500 shares since 2003 (2005, 2007, and 2014), the average losses is less than 0.5%. The average gain was near 2.5%, helped by a 5.1% rise in 2003, and 6.5% in 2010.
He has been covering the global capital markets in one fashion or another for more than 30 years, working at economic consulting firms and global investment banks. After 14 years as the global head of currency strategy for Brown Brothers Harriman, Chandler joined Bannockburn Global Forex, as a managing partner and chief markets strategist as of October 1, 2018.
Tags: Great Graphic