Keith Weiner
My articles My offerMy siteAbout meMy videosMy books
Follow on:LinkedINTwitterSeeking AlphaFacebookAmazonGoogle +
The price of gold dropped six bucks, and silver seven cents.
Without much price action, let’s look a few other angles to gain some perspective. First, here’s the chart of both silver and the decidedly not-monetary metal copper.
The Prices of Silver and Copper in Gold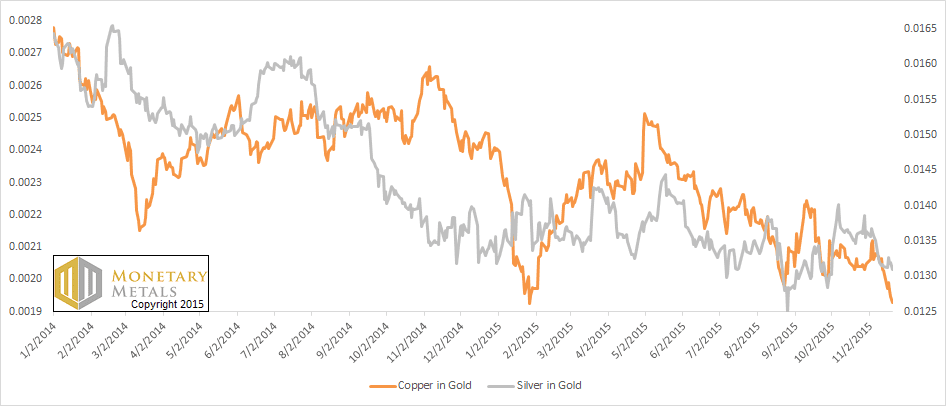
There’s a good correlation, with the biggest divergence being late 2014 through early this year. For copper, not being money, to hold out at a high price before dropping looks like hope in the recovery. Or if not that, then at least hope in QE and the theory that rising money supply causes rising commodity prices. It didn’t work, and the price of copper dropped. It’s still dropping and may yet break down below the low it made in late 2009.
Silver has an industrial component, so it’s no surprise to see its price drop as well. Now let’s zoom in for better resolution, by looking at a chart of copper priced in silver.
The Price of Copper in Silver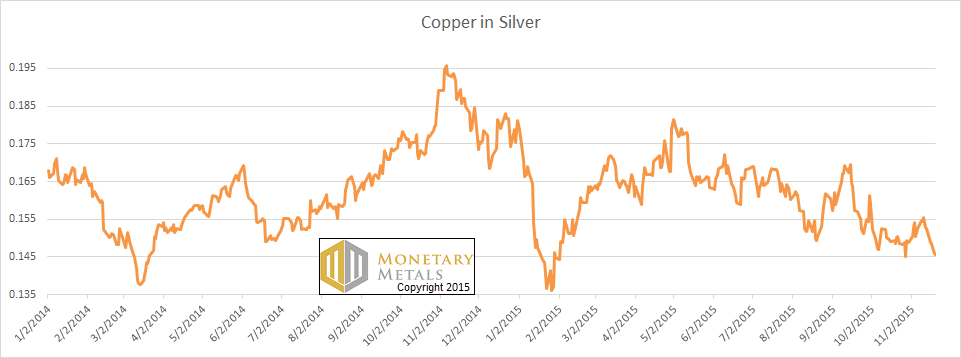
The price of copper in ounces of silver is nowhere near the low it made early this year, much less the low of 2009 or 2011. As production and trade decline, and as the rate of interest declines, we would expect the non-monetary commodities to fall in price. Silver, which is partly non-monetary has been falling in terms of gold. There’s no reason why copper shouldn’t fall in terms of silver (apologies for the double negative).
The headline this week isn’t just to be gratuitously provocative. $13 represents one distinct possibility. How distinct? Read on for the only true picture of supply and demand in gold and silver…
First, here is the graph of the metals’ prices.
The Prices of Gold and Silver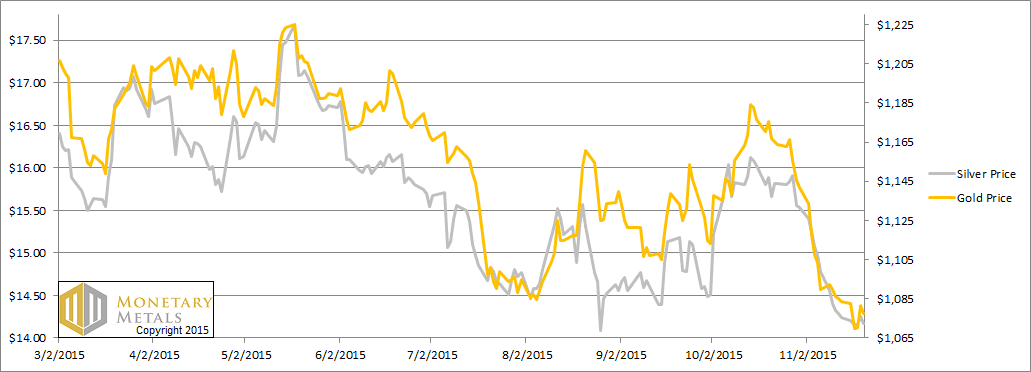
We are interested in the changing equilibrium created when some market participants are accumulating hoards and others are dishoarding. Of course, what makes it exciting is that speculators can (temporarily) exaggerate or fight against the trend. The speculators are often acting on rumors, technical analysis, or partial data about flows into or out of one corner of the market. That kind of information can’t tell them whether the globe, on net, is hoarding or dishoarding.
One could point out that gold does not, on net, go into or out of anything. Yes, that is true. But it can come out of hoards and into carry trades. That is what we study. The gold basis tells us about this dynamic.
Conventional techniques for analyzing supply and demand are inapplicable to gold and silver, because the monetary metals have such high inventories. In normal commodities, inventories divided by annual production (stocks to flows) can be measured in months. The world just does not keep much inventory in wheat or oil.
With gold and silver, stocks to flows is measured in decades. Every ounce of those massive stockpiles is potential supply. Everyone on the planet is potential demand. At the right price, and under the right conditions. Looking at incremental changes in mine output or electronic manufacturing is not helpful to predict the future prices of the metals. For an introduction and guide to our concepts and theory, click here.
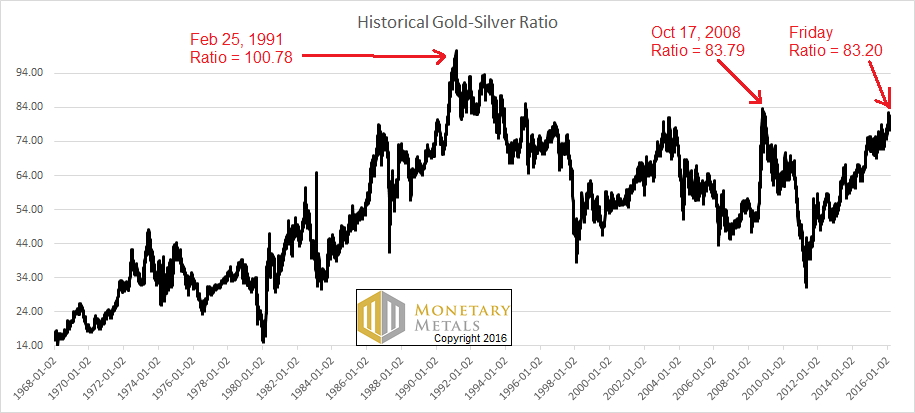
Next, this is a graph of the gold price measured in silver, otherwise known as the gold to silver ratio. The ratio barely moved.
The Ratio of the Gold Price to the Silver Price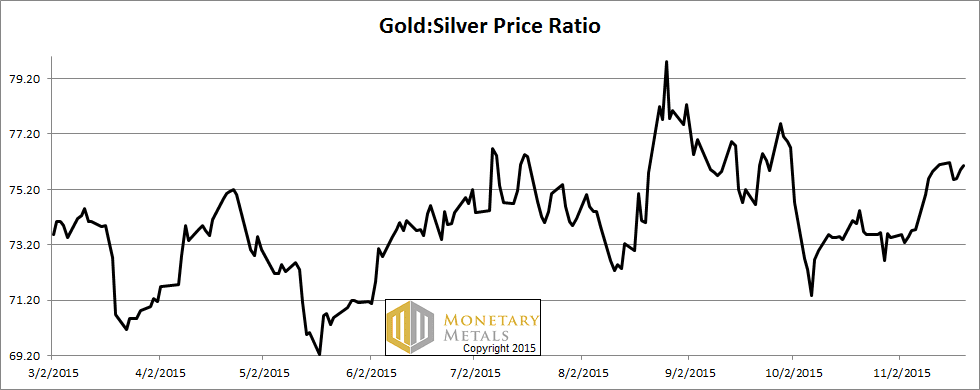
For each metal, we will look at a graph of the basis and cobasis overlaid with the price of the dollar in terms of the respective metal. It will make it easier to provide brief commentary. The dollar will be represented in green, the basis in blue and cobasis in red.
Here is the gold graph.
The Gold Basis and Cobasis and the Dollar Price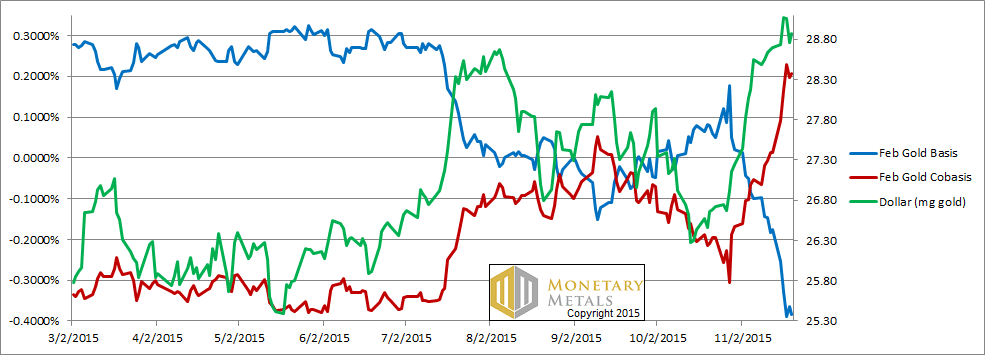
In both gold and silver, we switched to the next contract month. For gold, that’s February and for silver it’s March.
We feel like we’re recording a record that’s broken while we’re still in the studio (for younger readers, broken records would often keep repeating the same short bit of sound over and over). The price of the dollar tracked the cobasis (i.e. as the price of gold dropped, scarcity increased).
Our calculated fundamental price of gold is about $150 over the market price. In other words, the market is offering to sell you gold at about a 12.2% discount. Remember this for a moment.
Now let’s look at silver.
The Silver Basis and Cobasis and the Dollar Price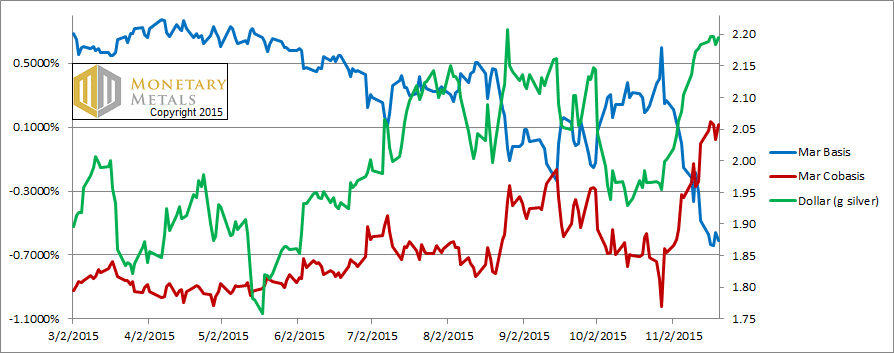
It’s a similar picture in silver.
In fact, silver is trading below its fundamental price also. However, it’s only at a 4.2% discount. If it were to go to its full fundamental value, and assuming that doesn’t change, it would be up near $15.
But what if it were to go on the same kind of sale as gold? At a discount of 12.2%, silver would be down near $13.
© 2015 Monetary Metals
Tags: Gold-Cobasis