


Keith Weiner
My articles My offerMy siteAbout meMy videosMy books
Follow on:LinkedINTwitterSeeking AlphaFacebookAmazonGoogle +
Early on Monday morning (Arizona time), silver began to rise. From its close on Friday of $15.46, it ran up to $15.82. Then it began to slide, eventually dropping to $15.17 by midmorning on Wednesday.

Photo credit: Ethan Miller / Getty Images
Then…
*BAM*
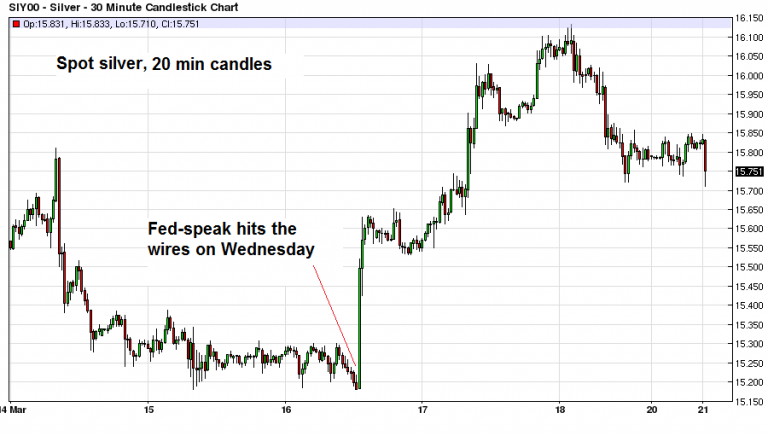
Spot silver over the past week. The release of the FOMC statement sparked a flurry of speculative buying – click to enlarge.
The Fed said not a lot. It will go on manipulating the rate of interest rate to the same level as it had been previously. This was not what the market was expecting, as many believed the Fed was on the war rate-hiking path. Lower interest means more quantity of money dollars which means more rising prices which means gold and especially silver should go up.
And go up, silver did. At least, if you measure it using muggle money. Silver ran up 44 cents on the Fed announcement. Then consolidated before running up over $16. It finally exhausted itself $16.15.
It ended the week at $15.78, about 30 cents higher than it began. As the muggles would reckon it, gold went up $5.
As always, we’re interested not so much in the price chart as the fundamentals of supply and demand. We like to know if a move was just leveraged speculators buying or selling futures, or if it was buyers or sellers of actual metal. The latter can tell us if a move will likely be durable or not.
This is a segue into an interesting question asked by a reader last week. He noted that the speculators are trying to predict the next price move. What if they’re right? Then a speculative move may lead a fundamental move.
That is true enough—if they’re right. The catch is knowing if they’re right, on a case by case basis. We have lost count of the number of times silver speculators have gotten excited and falsely predicted a breakout. There have been many corrections as the price of silver has dropped over the three years that we have been publishing our analysis, and the period before that when we had a private email letter. And when each of those corrections has exhausted itself, the downward price trend continued.
Have we seen the price bottom? We think it’s likely. At least, there is no fundamental reason for silver to go back to a 13 handle. On the other hand, if silver speculators became as depressed about their metal as gold speculators are, then that is exactly what would happen.
On the other, other hand—quick, somebody get me a one-handed economist!—we think it is more likely that bearish gold sentiment will slowly fade than that bearish sentiment will bleed over from gold to silver.
Price bottom aside, is there any reason to expect a skyrocketing silver price? Read on for the only true picture of the gold and silver supply and demand fundamentals (For an introduction and guide to our concepts and theory, click here.)
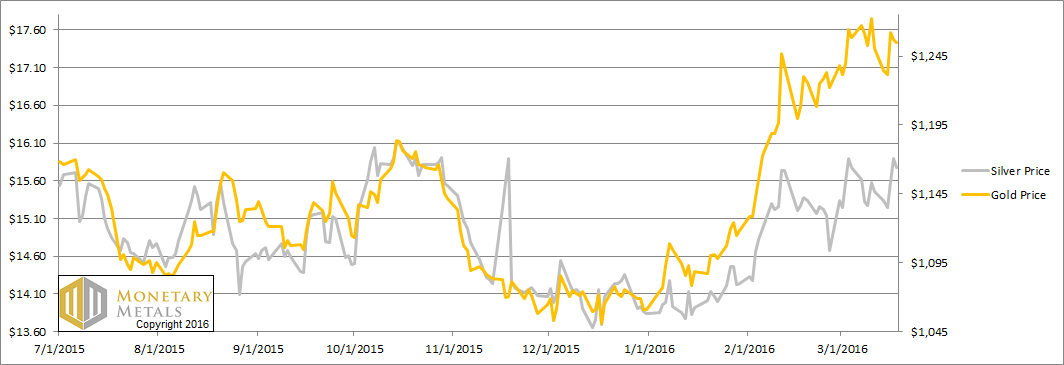
But first, here’s the graph of the metals’ prices.
The Prices of Gold and Silver
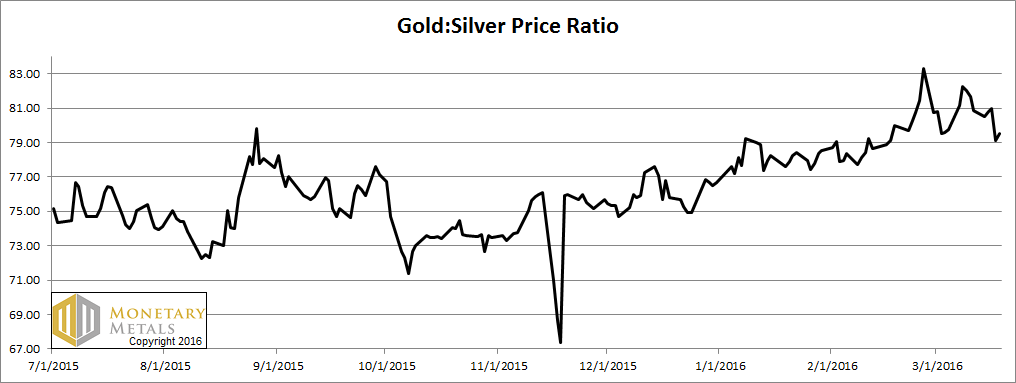
Next, this is a graph of the gold price measured in silver, otherwise known as the gold to silver ratio. The ratio was down again.
The Ratio of the Gold Price to the Silver Price
For each metal, we will look at a graph of the basis and cobasis overlaid with the price of the dollar in terms of the respective metal. It will make it easier to provide brief commentary. The dollar will be represented in green, the basis in blue and cobasis in red.
Here is the gold graph.
The Gold Basis and Cobasis and the Dollar Price
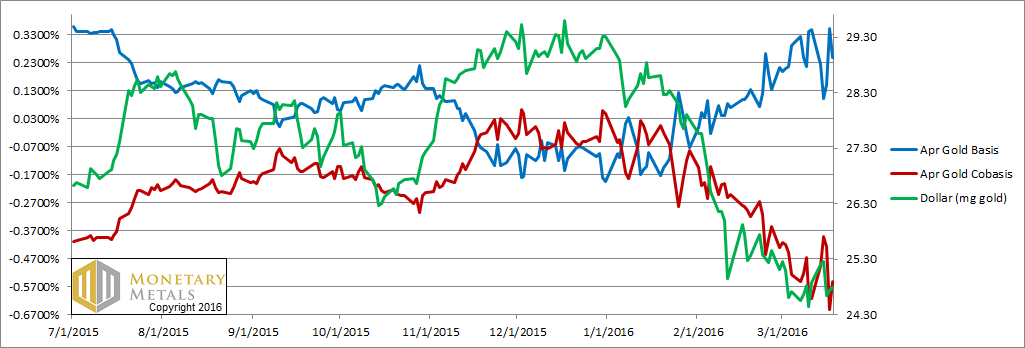
The green line is the price of the dollar, measured in gold terms (i.e. the inverse of the price of gold). As it falls (i.e. the gold price rises) gold becomes less scarce. The red line is the gold cobasis, our measure of scarcity of the metal. From last week:
Gold is becoming less scarce as its price is rising.
It’s almost eerie how well the gold scarcity tracks the dollar price, as they both descend. Almost as if there was a connection. Or something. ?
The uncanny tracking of gold scarcity with the price of the dollar continues.
Our calculated fundamental price of gold fell a few bucks again, but it’s still well over $1,400.
Now let’s look at silver.
The Silver Basis and Cobasis and the Dollar Price
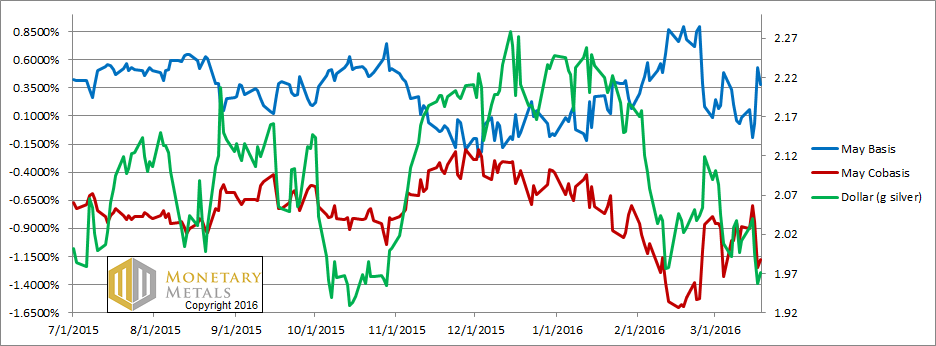
Last week, we noted that the silver fundamentals firmed up a bit. That was last week.
This week, scarcity synced back up with the price of the dollar again. Note the big drop in the cobasis, and big rise in the basis. Silver for May delivery is in a nice contango, though the 38 bps you could earn to carry silver is a bit under LIBOR.
The silver fundamental dropped over a nickel this week. It’s more than a buck below the market price.
Will the speculators be right this time? Is silver headed to $20, much less $50? We would not put our money in harms’ way (to borrow a phrase that Kevin O’Leary has used on Shark Tank) to bet on that thesis.
Monetary Metals will be in Hong for Mines and Money, and in Singapore for Mining Investment Asia. If you will be in town for either conference, and would like to meet, please drop us a line.
© 2016 Monetary Metals
Tags: Current Market News,Gold,Gold Contango,Gold-Cobasis


