


Keith Weiner
My articles My offerMy siteAbout meMy videosMy books
Follow on:LinkedINTwitterSeeking AlphaFacebookAmazonGoogle +
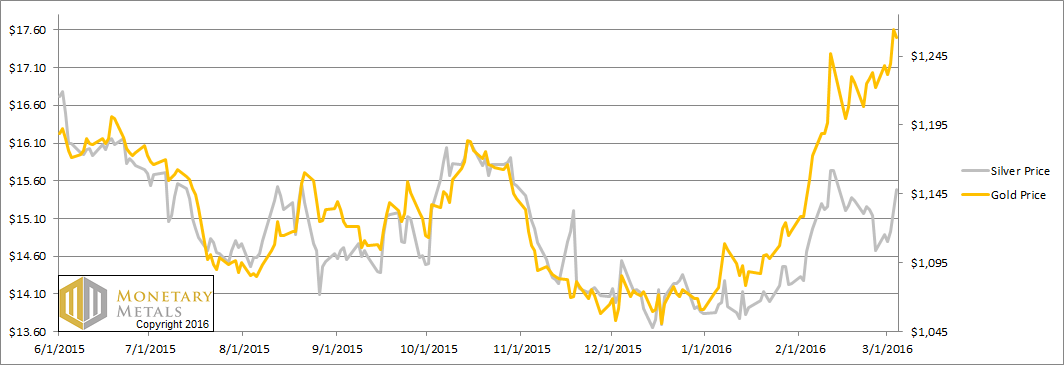
So the price of silver rocketed up 80 cents, while the price of gold jumped $37. Silver is now more expensive than it was two weeks ago; the price decline of last week was more than overcompensated.
This pushed the gold-silver ratio down about two whole points, with virtually the whole move on Friday.
 Last week, we said this:
 We are interested in the changing equilibrium created when some market participants are accumulating hoards and others are dishoarding. Of course, what makes it exciting is that speculators can (temporarily) exaggerate or fight against the trend. The speculators are often acting on rumors, technical analysis, or partial data about flows into or out of one corner of the market. That kind of information can’t tell them whether the globe, on net, is hoarding or dishoarding.
One could point out that gold does not, on net, go into or out of anything. Yes, that is true. But it can come out of hoards and into carry trades. That is what we study. The gold basis tells us about this dynamic.
Conventional techniques for analyzing supply and demand are inapplicable to gold and silver, because the monetary metals have such high inventories. In normal commodities, inventories divided by annual production (stocks to flows) can be measured in months. The world just does not keep much inventory in wheat or oil.
With gold and silver, stocks to flows is measured in decades. Every ounce of those massive stockpiles is potential supply. Everyone on the planet is potential demand. At the right price, and under the right conditions. Looking at incremental changes in mine output or electronic manufacturing is not helpful to predict the future prices of the metals. For an introduction and guide to our concepts and theory, click here.
Next, this is a graph of the gold price measured in silver, otherwise known as the gold to silver ratio. The ratio was down.
The Ratio of the Gold Price to the Silver Price
We are interested in the changing equilibrium created when some market participants are accumulating hoards and others are dishoarding. Of course, what makes it exciting is that speculators can (temporarily) exaggerate or fight against the trend. The speculators are often acting on rumors, technical analysis, or partial data about flows into or out of one corner of the market. That kind of information can’t tell them whether the globe, on net, is hoarding or dishoarding.
One could point out that gold does not, on net, go into or out of anything. Yes, that is true. But it can come out of hoards and into carry trades. That is what we study. The gold basis tells us about this dynamic.
Conventional techniques for analyzing supply and demand are inapplicable to gold and silver, because the monetary metals have such high inventories. In normal commodities, inventories divided by annual production (stocks to flows) can be measured in months. The world just does not keep much inventory in wheat or oil.
With gold and silver, stocks to flows is measured in decades. Every ounce of those massive stockpiles is potential supply. Everyone on the planet is potential demand. At the right price, and under the right conditions. Looking at incremental changes in mine output or electronic manufacturing is not helpful to predict the future prices of the metals. For an introduction and guide to our concepts and theory, click here.
Next, this is a graph of the gold price measured in silver, otherwise known as the gold to silver ratio. The ratio was down.
The Ratio of the Gold Price to the Silver Price
 For each metal, we will look at a graph of the basis and cobasis overlaid with the price of the dollar in terms of the respective metal. It will make it easier to provide brief commentary. The dollar will be represented in green, the basis in blue and cobasis in red.
Here is the gold graph.
The Gold Basis and Cobasis and the Dollar Price
For each metal, we will look at a graph of the basis and cobasis overlaid with the price of the dollar in terms of the respective metal. It will make it easier to provide brief commentary. The dollar will be represented in green, the basis in blue and cobasis in red.
Here is the gold graph.
The Gold Basis and Cobasis and the Dollar Price
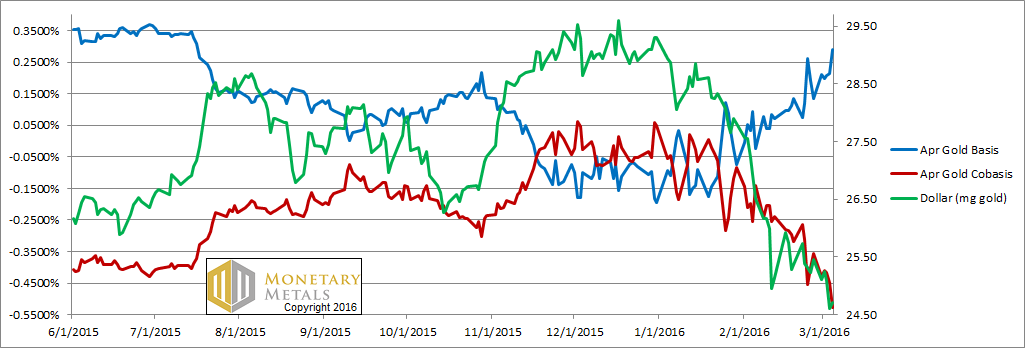 The picture couldn’t be clearer. The green line is the price of the dollar, measured in gold. It is falling (the inverse of what people think of as gold going up). The red line is the cobasis, our scarcity indicator.
Gold is becoming less scarce as its price is rising.
It’s almost eerie how well the gold scarcity tracks the dollar price, as they both descend. Almost as if there was a connection. Or something. ?
We have a proprietary algorithm that calculates a fundamental price for each metal. The concept is simple. What if we could back out the price impact of speculators, and see where price would be if supply and demand for metal were balanced?
The answer is $1,431.
Now let’s look at silver.
The Silver Basis and Cobasis and the Dollar Price
The picture couldn’t be clearer. The green line is the price of the dollar, measured in gold. It is falling (the inverse of what people think of as gold going up). The red line is the cobasis, our scarcity indicator.
Gold is becoming less scarce as its price is rising.
It’s almost eerie how well the gold scarcity tracks the dollar price, as they both descend. Almost as if there was a connection. Or something. ?
We have a proprietary algorithm that calculates a fundamental price for each metal. The concept is simple. What if we could back out the price impact of speculators, and see where price would be if supply and demand for metal were balanced?
The answer is $1,431.
Now let’s look at silver.
The Silver Basis and Cobasis and the Dollar Price
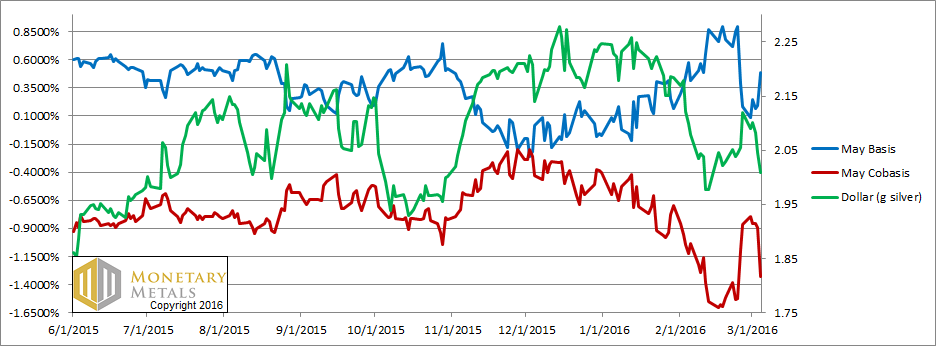 The same story exists in silver. As its price has risen, it has become less scarce. The difference with silver is the absolute level of the cobasis. It is -133 basis points, compared to -53 in gold.
What if we could calculate what the price would be, if supply of physical metal matched demand?
$14.09.
While speculators are pushing the price of gold down, $170 below its fundamentals, they are pulling silver $1.40 above.
As we said last week, we suspect some of these speculators are precious metals fans, who feel that an 80:1 gold-silver ratio is excessive. It’s just about touched the 2008 high (but nowhere near the level hit in 1991). Is time for the ratio to reverse and move back towards the low set in 2011?
Perhaps a reader can suggest a quote from Firefly or Star Trek or some other science fiction show. The key point that this quote must make is: “don’t bet on it.”
Unless these would-be gold-silver arbitrageurs get lucky, and the silver fundamentals firm up soon, their trade will end in tears.
In the meantime, silver is correcting along with junk bonds, crude oil, and other assets.
Keith will be speaking at Mines and Money in Hong Kong, April 5-7, and Mining Investment Asia April 13-15 in Singapore. Please contact us if you would like to meet up around either conference.
© 2016 Monetary Metals
The same story exists in silver. As its price has risen, it has become less scarce. The difference with silver is the absolute level of the cobasis. It is -133 basis points, compared to -53 in gold.
What if we could calculate what the price would be, if supply of physical metal matched demand?
$14.09.
While speculators are pushing the price of gold down, $170 below its fundamentals, they are pulling silver $1.40 above.
As we said last week, we suspect some of these speculators are precious metals fans, who feel that an 80:1 gold-silver ratio is excessive. It’s just about touched the 2008 high (but nowhere near the level hit in 1991). Is time for the ratio to reverse and move back towards the low set in 2011?
Perhaps a reader can suggest a quote from Firefly or Star Trek or some other science fiction show. The key point that this quote must make is: “don’t bet on it.”
Unless these would-be gold-silver arbitrageurs get lucky, and the silver fundamentals firm up soon, their trade will end in tears.
In the meantime, silver is correcting along with junk bonds, crude oil, and other assets.
Keith will be speaking at Mines and Money in Hong Kong, April 5-7, and Mining Investment Asia April 13-15 in Singapore. Please contact us if you would like to meet up around either conference.
© 2016 Monetary Metals
Full story here
Are you the author?
Last week, we said this:
Monetary Metals has been predicting a ratio well over 80 for a long time. And for two months, we have been calling for it to go much higher still. Could there be a correction? Absolutely. Could the fundamentals change? We expect they will—at some point. We will call that when we see it.
Is this a correction? Or is this the reversal of the fundamentals? Was this price-lifting buying spree stackers, taking delivery of bars and coins? Or was it leveraged speculators placing their bets on paper contracts? Read on for the only true picture of the gold and silver supply and demand fundamentals… But first, here’s the graph of the metals’ prices. The Prices of Gold and Silver
We are interested in the changing equilibrium created when some market participants are accumulating hoards and others are dishoarding. Of course, what makes it exciting is that speculators can (temporarily) exaggerate or fight against the trend. The speculators are often acting on rumors, technical analysis, or partial data about flows into or out of one corner of the market. That kind of information can’t tell them whether the globe, on net, is hoarding or dishoarding.
One could point out that gold does not, on net, go into or out of anything. Yes, that is true. But it can come out of hoards and into carry trades. That is what we study. The gold basis tells us about this dynamic.
Conventional techniques for analyzing supply and demand are inapplicable to gold and silver, because the monetary metals have such high inventories. In normal commodities, inventories divided by annual production (stocks to flows) can be measured in months. The world just does not keep much inventory in wheat or oil.
With gold and silver, stocks to flows is measured in decades. Every ounce of those massive stockpiles is potential supply. Everyone on the planet is potential demand. At the right price, and under the right conditions. Looking at incremental changes in mine output or electronic manufacturing is not helpful to predict the future prices of the metals. For an introduction and guide to our concepts and theory, click here.
Next, this is a graph of the gold price measured in silver, otherwise known as the gold to silver ratio. The ratio was down.
The Ratio of the Gold Price to the Silver Price
For each metal, we will look at a graph of the basis and cobasis overlaid with the price of the dollar in terms of the respective metal. It will make it easier to provide brief commentary. The dollar will be represented in green, the basis in blue and cobasis in red.
Here is the gold graph.
The Gold Basis and Cobasis and the Dollar Price
The picture couldn’t be clearer. The green line is the price of the dollar, measured in gold. It is falling (the inverse of what people think of as gold going up). The red line is the cobasis, our scarcity indicator.
Gold is becoming less scarce as its price is rising.
It’s almost eerie how well the gold scarcity tracks the dollar price, as they both descend. Almost as if there was a connection. Or something. ?
We have a proprietary algorithm that calculates a fundamental price for each metal. The concept is simple. What if we could back out the price impact of speculators, and see where price would be if supply and demand for metal were balanced?
The answer is $1,431.
Now let’s look at silver.
The Silver Basis and Cobasis and the Dollar Price
The same story exists in silver. As its price has risen, it has become less scarce. The difference with silver is the absolute level of the cobasis. It is -133 basis points, compared to -53 in gold.
What if we could calculate what the price would be, if supply of physical metal matched demand?
$14.09.
While speculators are pushing the price of gold down, $170 below its fundamentals, they are pulling silver $1.40 above.
As we said last week, we suspect some of these speculators are precious metals fans, who feel that an 80:1 gold-silver ratio is excessive. It’s just about touched the 2008 high (but nowhere near the level hit in 1991). Is time for the ratio to reverse and move back towards the low set in 2011?
Perhaps a reader can suggest a quote from Firefly or Star Trek or some other science fiction show. The key point that this quote must make is: “don’t bet on it.”
Unless these would-be gold-silver arbitrageurs get lucky, and the silver fundamentals firm up soon, their trade will end in tears.
In the meantime, silver is correcting along with junk bonds, crude oil, and other assets.
Keith will be speaking at Mines and Money in Hong Kong, April 5-7, and Mining Investment Asia April 13-15 in Singapore. Please contact us if you would like to meet up around either conference.
© 2016 Monetary Metals
Keith Weiner is president of the Gold Standard Institute USA in Phoenix, Arizona, and CEO of the precious metals fund manager Monetary Metals.
Tags: Current Market News,Gold,gold silver ratio,Gold-Cobasis


