


George Dorgan
My articles My siteAbout meMy videosMy books
Follow on:LinkedINTwitterSeeking Alpha
CFA SocietyEconomicBlogs
Fundamentals with highest importance:
In Janet Yellen’s hearing at the Senate Banking Commission, the future Fed chair emphasized the need to provide support to the economic recovery and to overcome low inflation. Her speech supported equities, gold and US Treasuries.
GDP in the Euro zone rose by 0.1% QoQ in line with expectations, but less than the 0.3% in Q2. Despite the recent critique with Germany, the main driver of 0.3% German GDP growth was consumption and not exports. French (-0.1%), Italian (-0.1%) and Spanish growth (+0.1%) rates were close to zero.
High importance:
Inflation is weakening further in Europe, the UK inflation rate is at 2.2% (previously 2.7%), the Swedish CPI stands at -0.1% YoY and the Eurozone HICP at 0.7% (down from 1.1%). The Eurozone Core CPI is at 0.8%.
European inflation rates can be divided in three groups:
- Higher inflation in countries that have low unemployment: Germany (1.2%), Austria (1.5%), Finland (1.7%), the UK (2.2%) and Norway (2.3%). Inflation is often increased by higher prices for food and services (that includes rents).
- Moderately high inflation in nations with relatively low salaries and stronger GDP growth like Estonia (2.2%), Czech Republic (+0.8%), Poland and Slovakia (both 0.7%). After last year’s European austerity exercise, inflation rates are currently falling even in these low-income countries. Disinflation combined with higher GDP growth potential makes them attractive for investors, e.g. in the FX interventions by the Czech National Bank.
- Deflation or low inflation in countries with high unemployment: Between -1.9% for Greece, -0.5% Cyprus, 0% Spain, +0.7% France and +0.8% in Italy.
Japanese GDP increased by 0.5% QoQ. With rising prices, private consumption improved by only 0.1% after 0.6% in Q2. The main upwards contributors were public investment (+6.5% QoQ) and private residential investment (+2.7%). The GDP deflator still points to deflation of -0.3%.
The U.S. trade deficit in goods and services widened to 41.8 bln. US$ in September 2013. This is about 3.1% of (monthly) GDP. The 205 bln. US$ imports of crude oil in the first 9 months this year were far less than 239 bln. in the same period of last year. However the deficit in automobiles and consumer goods increased by 4 bln and 5 bln. $ respectively. In particular imported cell phones and other household goods rose from 59 to 67 bln. $ and reflected a higher deficit with China, expressing rising global imbalances. In sum the third quarter the U.S. had a deficit of 119 bln. US$, which is identical to Q2. Therefore the improvement in trade, namely +4.5% in exports vs. +1.9% in imports, delivered in last week’s preliminary GDP release is difficult to comprehend and might be subject to a downwards revision.
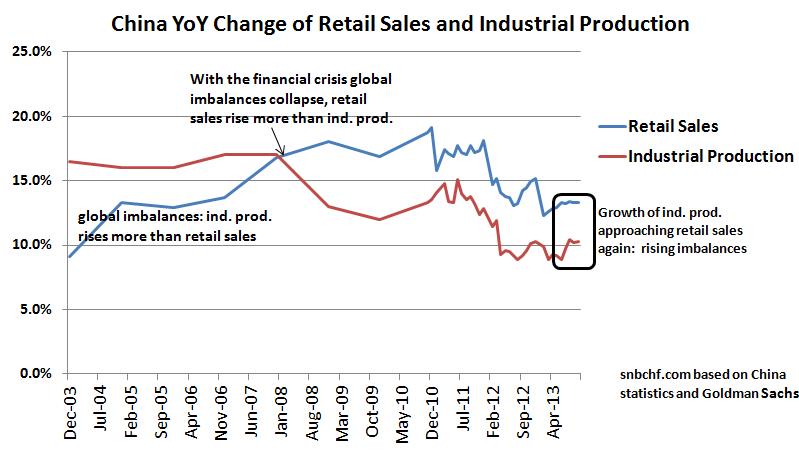
Chinese industrial production inched up 10.3% y/y, more than the 10% expected, while retail sales increased 13.3%. The growth rates of industrial production and retail sales are getting closer: this means rising global imbalances.
The Chinese industrial producer price index (PPI) continued the deflationary tendencies (-1.5% y/y), while the consumer price index (CPI) was up to 3.2% y/y, the highest level since May 2012. For us, the small difference between PPI and the purchaser price index of -1.6% shows that Chinese companies are able to slash costs despite rising wages. Chinese authorities seem to be successful in preventing wage hikes. The higher CPI was driven by 6.5% higher food prices that make up 32% of the basket. The CPI, however, indicates that salaries should rise.
Chinese money supply rose by 14.2% y/y, which implies that the PBoC is still struggling to stop strong credit growth and should keep a tightening bias. The number is lower than the excessive 20% attained in 2010, but higher than the 12% in Spring 2012.
Industrial production in the euro zone inched down by 0.5% in September against August, but rising capital goods proved rising investments. Compared with September 2012, however, it was up 1.1%. German production rose by 1.3% y/y, the French one was nearly unchanged, the ones of Eastern European countries increased between +2% and +9%, while Italy, Sweden and Finland lagged.
Industrial production in the United States was down -0.1% MoM in October (or +3.2% YoY) while both August and September were strong with 0.5% and 0.7%.
The Bank of England sees its target of 7% unemployment reached by Q3/2015 and the 2% inflation target already in 2014. This is earlier than the bank expected previously. The unemployment rate inched down to 7.6% in September from 7.7% in August.
Medium importance
Chinese leaders revealed a plan to implement wide ranging and deepening reforms.
The Japanese not seasonally adjusted current account for September improved to 587 bln. Yen, about 1.1% of (monthly) GDP. The adjusted current account, however, fell to -130 bln. Yen.
Japanese industrial production edged up 1.5% MoM or 5.1% YoY against October 2012, when Japan had a row with China.
The Japanese PPI for goods, the CGPI edged up by 2.5% against October 2012, reflecting the 25% rise of the USD/JPY exchange rate during that period.
Standard & Poors’ downgraded France from AA+ to AA. In particular, they criticized that public debt is to be reduced mostly via tax hikes in a country where the tax burden is already very high.
The Chicago Fed National Activity came in at 0.14, still in expansion territory. The American NFIB Small Business Optimism dipped to 91.6, the lowest level since April. The New York Empire State Manufacturing index even went into contraction territory with -2.21. Once again the good ISM PMI values did not get confirmed by regional data.
The store sales activities in the Redbook continued the slight contraction trend by 1% MoM since September 10, 2013. The yearly figures are up 3.3% after a top of 4.7% in September.
More on Emerging Markets:
Despite somewhat higher PMIs, the slowing in emerging markets (except China) continued: Mexican industrial production inched down 1.6% y/y after only -0.4% in the previous month. Indian production improved only by 2% y/y.
The central banks of Russia, Indonesia and Brazil are still fighting inflation and remained in tightening mode with lending rates of 5.5%, 7.5% and 9.5% respectively. Due to still high inflation, Russian GDP increased by only 1.2% in Q3/2013 y/y, economists see Brazil grow by 2.1% in 2014. In 2011 and early 2012 Russian GDP growth was still 4.9%. Brazilian GDP rose by 7.5% in 2010, by 2.7% in 2011 and only 0.9% in 2012.
FX Price Movements
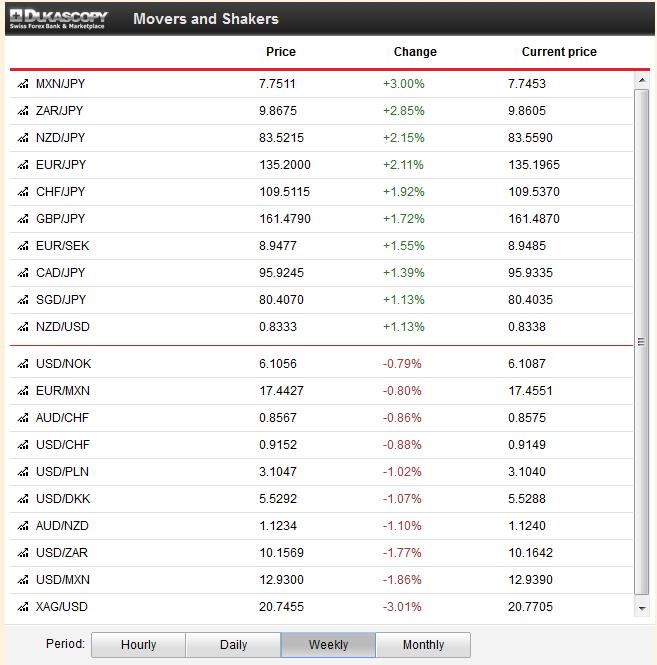
Helped by some weaker Japanese data, the clear loser of the week was the Japanese yen. Thanks to Yellen’s supports, stocks and US Treasuries rallied. Especially after the announcement of Chinese reforms, stocks rose even more and the funding currency JPY depreciated. The winners were the risk-on currencies MXN, ZAR, NZD, CAD and EUR, while the US dollar and the yen lagged. Good Chinese news helped the rest of the Asian bloc, namely NZD, SGD and AUD, to appreciate.
Swiss data and news
Recent good US data are visible on the SNB balance sheet. For the second week in a row SNB sight deposits have fallen by around 500 million (compared to a total of 368 bln. not a lot). We judge that foreign banks are retreating some funds from Switzerland (details).
The UBS bought back the Stabfund from the SNB, a win of 5.3 bln. CHF for the central bank – details. On the other side, it will still be years before the UBS will start to pay taxes, thanks to unused tax losses carried forward – details (in German).
The Swiss regulator FINMA and the SNB have declared the Zurich Cantonal Bank (ZKB) as “system-relevant”, which implies that the bank needs to increase capital. – details.
Thanks to cheaper energy, the Swiss producer price index moved into deflation again: -0.3% YoY after 0.0% last month.
Gold, Silver and CHF
With Yellen’s support, gold remained stable this week around 1292$, even if last week’s strong NFP figures initially weakened the yellow metal. Silver depreciated by 3% given the good NFP figures and continuing low growth in emerging markets (except China). Yellen’s support and the not so bad European GDP figures helped EUR/CHF to gain some 30 pips from 1.2317 to 1.2347. Unconvincing U.S. data and Yellen’s pressure weakened the USD/CHF rate from 0.9216 to 09148.
Are you the author?
Tags: Asian bloc,China Industrial Production,ECB,European inflation,Federal Reserve,FX news,Gold,Janet Yellen,Japan Producer Price Index,silver,U.S. NY Empire State Manufacturing Index,U.S. Retail Sales


