


George Dorgan
My articles My siteAbout meMy videosMy books
Follow on:LinkedINTwitterSeeking Alpha
CFA SocietyEconomicBlogs
Fundamentals with highest importance:
The U.S. GDP release for Q3, showed that despite the recent U.S. critique with Germany, the Americans are trying to follow the successful Germans: for the first time since Q1/2012 and Q2/2011 exports rose more than imports. GDP was up 2.8%, but not driven by consumption, it was mostly helped by exports (pink color below) and inventories (green). The 1.5% rise in personal consumption, however, is comparable to the criticized Germany that had +1.1% in Q2 and probably more than that in Q3.
Especially the increase in inventories is a typical movement when companies bet on rising spending, but consumers do not follow. This happened similarly in Japan in 1998/1999, the yen strongly appreciated and economists thought that Japan would leave its (first) lost decade (see details).

source Zerohedge
The ISM Non-Manufacturing PMI appreciated from 54.4 to 55.4 despite the government shutdown. This PMI is the most important economically, and strongly related to GDP. Improvements against last month could be found in activity/production (59.7) and the employment (56.2) component, while new orders (56.8 down from 59.6) and exports (53.0) expanded less than last month. Prices paid (56.1) to suppliers are still high.
The European Central Bank reduced its key lending rate from 0.5% to 0.25%. Even if the decision generated many headlines, the euro did not depreciate a lot because the deposit rate remained at 0%. EONIA rates depreciated by around 10 basis points.
According to the Non-Farm Payrolls report, American firms created 212K new jobs, far more than the 125K expected. Furloughed workers affected by the government shutdown were not considered as unemployed in this survey. In the second survey, the household survey, however, many furloughed workers were considered as temporarily unemployed or even as “out of the labor force”. Therefore, unemployment increased to 7.3% and the participation rate decreased to 62.8%. On Bloomberg, Prof Wolfers brought the argument that due to the shutdown, firms had a week more time to provide data. He judges that this statistical bias and the weak household survey data would have reduced job creation to 106K jobs.
High importance:
The official Chinese services PMI increased from 55.4 to 56.3 in September and the HSBC services PMI from 52.4 to 52.6. This confirmed the continuing Chinese recovery.
The Chinese trade surplus increased to its highest level this year, close to record-high levels. Exports were up 5.6% y/y and imports 7.6%. The surplus indicates two things: The Chinese are affected by global austerity but they are able to cut costs sufficiently.
The eurozone manufacturing PMI remained stable at 51.3. German manufacturing was stronger, but Italian and French weakened. The eurozone services PMI fell to 51.6 after a value of 52.2 in September, which was driven by higher German and French values.
Medium importance:
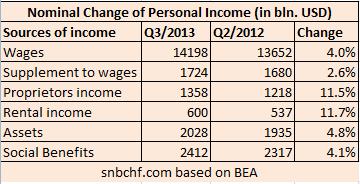
source BEA
U.S. factory orders (excl. the volatile transportation component) for August and September depreciated by 0.4% and 0.2% and contradicted the recently strong ISM manufacturing PMI.
Personal income in the U.S. rose by 0.5% in September. The increase was once again mostly driven by rental and proprietors income.
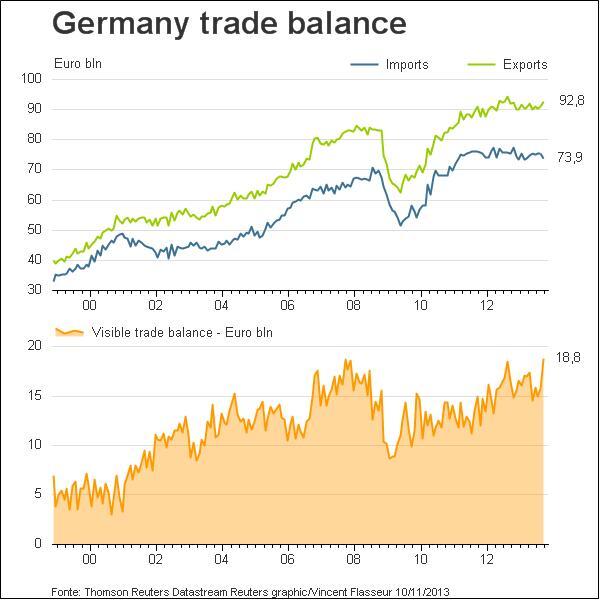 The European producer price index (PPI) fell by 0.9% YoY compared to the 1.2% increase for the U.S. and minus 1.5% for China. For us it means that Chinese and Europeans are able to reduce costs more than U.S. firms. The weak German PPI of -0.4% and cheaper German prices were reflected in a record-high German trade surplus for goods of 18.8 billion €, 6 % of monthly GDP.
German factory orders rose strongly by 3.3% MoM in September but industrial production inched down by 0.9% MoM. European retail sales in September were down on the month, but nearly unchanged YoY.
The UK continued to witness good data: rising industrial production (+2.2% yoy), higher house prices (+6.9% YoY), higher retail sales (+0.8% YoY) and a NIESR GDP Estimate of +0.7% QoQ. The British PMIs were “over-enthusiastic” PMIs of 56.0 for manufacturing, 59.1 for construction and a 16-year high of 60.1 for the services.
For us, higher PMIs are an expression of higher consumer spending thanks to a recovery in stock markets and in the British banking industry. Higher spending was visible in the close to record-high British trade deficit in goods (about -5% of GDP) and slight improvements in services (+3.2% of GDP). The total trade deficit continues to expand, more details at the ONS.
Swiss data
In line with falling inflation in Europe, the Swiss inflation rate fell to -0.3%, the HICP is currently 0.0% versus 0.7% in the Euro zone. In both Europe and Switzerland, recent lower energy and food prices helped to reduce costs. Prices of Swiss services are rising by 0.7% YoY.
Weekly FX rates
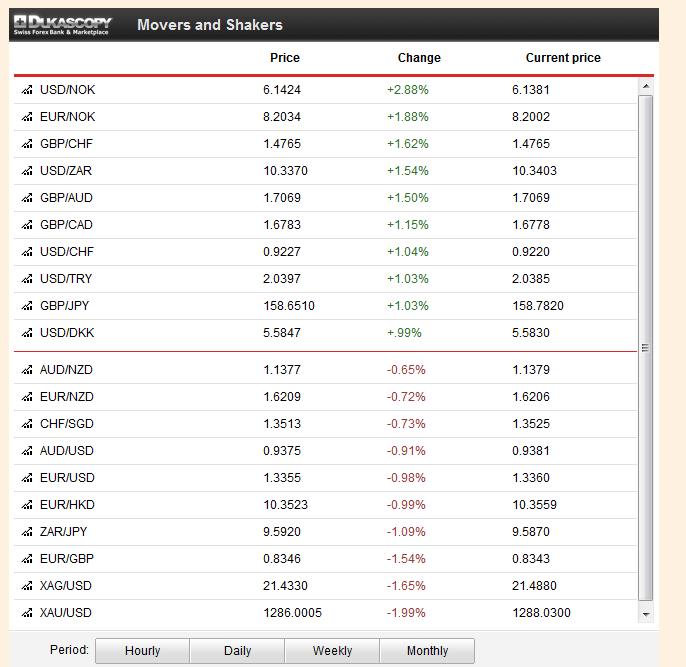
The winners of the week were the US dollar and pound sterling thanks to very good fundamental data. But US GDP was too good, with the consequence that on Thursday stocks depreciated and the founding currency JPY improved.
Better Chinese data did not help the Asian bloc. Both the risk-on currencies AUD and NZD – aided by soft Australian unemployment data – and the safe-havens JPY and SGD depreciated against the dollar.
The European risk-on currencies NOK and SEK were hit hard on Thursday by two pieces of news:
- The ECB spoke about prolonged European low inflation. Traders interpreted this as longer than expected low Norwegian and Swedish interest rates or even rate cuts.
- The stronger U.S. GDP could lead to an outflow of American risk-on funds from Norway and Sweden.
Weekly FX Rate Performance, from November 4 to November 8
Gold, Silver and CHF
Due to the good US data, gold fell under the important 1300$ barrier again, while silver was not hit that strongly. Both the U.S. and emerging markets are recovering, this helps the silver price. But due to smaller surpluses in China and other emerging markets, gold demand by central banks is weak. Consequently, the gold/silver ratio should shrink further.
With better US data, CHF weakened against the dollar by about 1%, the EUR/CHF rate was nearly unchanged. As usual EUR/CHF appreciated with better U.S. data. The ECB rate cut limited the improvement from 1.2306 to 1.2317 during this week. After the ECB cut, the pair had dipped to 1.2284.
Are you the author?Tags: Asian bloc,ECB,European inflation,Federal Reserve,FX news,Germany Factory Orders,Gold,Norwegian Krone,silver,Switzerland Trade Balance,U.S. ISM Manufacturing PMI,U.S. ISM Non-Manufacturing PMI,U.S. Nonfarm Payrolls


