


George Dorgan
My articles My siteAbout meMy videosMy books
Follow on:LinkedINTwitterSeeking Alpha
CFA SocietyEconomicBlogs
This week had a focus on – due to the government shut-down – the long awaited U.S. data:
Highest importance:
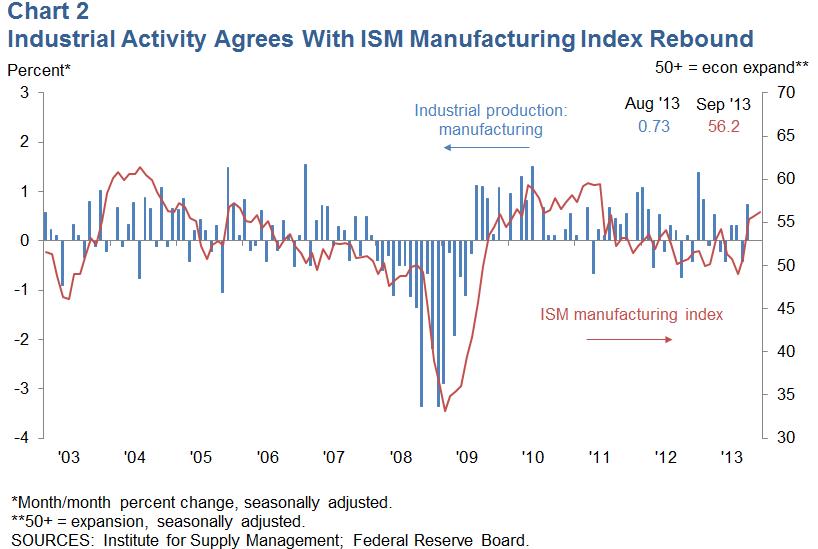
The ISM Manufacturing Purchasing Manager Index (PMI) for October came in at 56.4, higher than the 55 expected. The value for new orders and for production remained above 60 despite the government shutdown. The value for exports increased from 52 to 57.
The PMI for January through October (53.3 percent) corresponds to a 3.5 percent increase in real gross domestic product (GDP) on an annualized basis. In addition, if the PMI™ for October (56.4 percent) is annualized, it corresponds to a 4.4 percent increase in real GDP annually.” source ISM report
FOMC Meeting: The Fed keeps asset purchases unchanged, but the policy statement suggested that “tapering” could start earlier than investors thought (more on Tim Duy’s Fed Watch).
Inflation in the euro zone fell to 0.7% after 1.1% in September. Even the less volatile core inflation decreased to 0.8%. This triggered expectations that the ECB could cut interest rates.
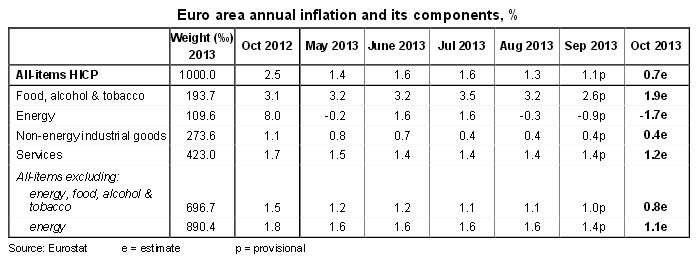
source Eurostat
Disinflation, for us, is expected: European leaders wanted to lower labor costs and wages in the periphery and – with the (Southern) European recession – even German unemployment has risen and previous German salary hikes slowed. But as the details above show, prices of services are up 1.2% YoY. The Eurozone is still far from deflation and lower salaries. We remind our readers of the core thesis of our blog that emphasizes that Swiss and euro zone inflation rates will converge. Spanish inflation has already reached Swiss levels, it increased by only 0.1% YoY.
The official Chinese Manufacturing PMI improved to 51.4 from 51.1 and the HSBC Manufacturing PMI to 50.9 from 50.2.
High importance:
U.S. Industrial production improved by 0.6% in September after 0.4% in August. The increase was mostly driven by utilities (+4.4% MoM). The U.S. managed to achieve the same level as 2007 again, after production had fallen by 20% during the recession.
In 2012 effective production seemed to be stronger than the ISM. The reason might be excessive risk aversion due to the European debt crisis. This year, however, both indicators are in line.
U.S. Retail Sales decreased by -0.1% MoM, while retail sales excluding autos and gasoline were up 0.4%. After strong figures in the summer months, auto sales cooled down a bit. The following picture impressively shows how in 2011 Europe followed the U.S. into sharp austerity as expressed in car sales, three years after the financial crisis.
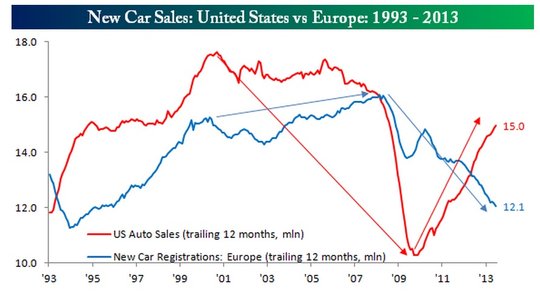
source Track.com
According to S&P/Case Shiller, U.S. house prices rose again by 1.3% MoM or 12.8% YoY, more than expected.
The Markit Manufacturing PMI for the U.S. contradicted the ISM PMI and indicated a level of 51.8. Especially the output component showed sharp differences to the equivalent “production component” of the ISM index that had a value of 60.2. The Markit PMI compares month against month and was more affected by the recent government shutdown while the ISM PMI is more longer-term oriented. Moreover by definition (see under the ISM above) ISM values are higher.
U.S. consumer prices were up 1.2% YoY, core inflation 1.7%, while services and shelter increased by 2.4%. The smaller headline figure was driven by energy that was down -3.1% on the year.
In September the European unemployment rate remained at 12.2% vs. 12.0% expected. The Italian rate increased from 12.4% to 12.5%, while the German Eurostat “harmonised unemployment rate” (see page 2 of the release) fell to 5.2%. The official German rate remained stable at 6.9%.
German retail sales continued to under-perform for years. It increased by only 0.2% YoY.
Medium importance:
The Dallas Fed Business Activity Index decreased to 3.6 from 12.8, a reason might be the dependency of this region on higher oil prices. On the other side, the Chicago PMI improved to 65.9, far more than expected. The Chicago region and its auto-makers takes advantage of low gasoline prices.
Due to furloughed workers, initial jobless claims were once again not convincing with a value of 340K. The ADP Nonfarm Employment change was weaker than expected with 130K new jobs, far lower than values of up to 200K seen this summer.
The producer price index (PPI) for the U.S. rose by 0.3% YoY. This after a YoY increase of 2.5% still in June. We remember the strong rise of oil prices between June and September 2012 thanks to QE3 and Draghi’s “whatever it takes”. This money printing effect has been washed out now by the economic reality. But also the core PPI increased only by 1.2% after 1.7% in June.
Crude oil inventories have risen further as processing at refineries has been slowed by maintenance and outages. Crude oil fell down to 96 $. Gasoline prices are 8% cheaper than one year ago.
The Japanese unemployment rate fell from 4.1% to 4%. Industrial production rose 1.5% against August. In August it was down 0.4% YoY. Retail sales and household spending were up 3.1% and 3.7% YoY, far higher than the previous figures. Falling disposable income of -0.4% YoY shows how Abenomics forces families to spend more on fuel, transportation, education and how these measures allocated the income of poorer people to entrepreneurs and stock owners. For us, Abeconomics will not be able to change the Japanese consensus-oriented mentality which prefers giving work to everybody, while individuals are reluctant to demand higher salaries.
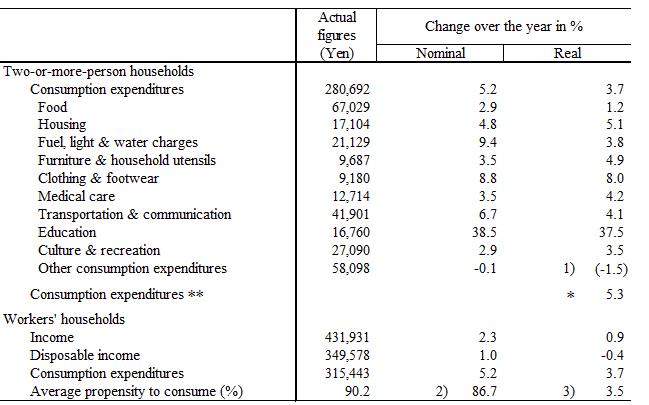
Japanese consumption versus income, source Japan Statistics
The Spanish recession has ended: GDP rose by 0.1% QoQ but was down -1.2% YoY. GDP was mostly driven by higher exports, but not by spending. The British Manufacturing PMI was still strong at 56.0 after previously being 56.3, while the Canadian RBC Manufacturing strengthened to 55.6.
After last week’s bad performance, the NZD was sustained by the RBNZ’s Wheeler who spoke about rate hikes in 2014, but the currency was still under pressure when Moody’s said it considered downgrading New Zealand’s credit rating due to the continuing current account deficit.
Terms of trades of the Australian trade are weakening – imports +6.1%, exports +4.4%. This is bad for the Australian economy, a fact highlighted by RBA governor Stevens.
Emerging markets:
Brazilian industrial production increased 2% YoY after a -1.2% contraction in August, but the trade balance went into negative territory. Similarly, the Indonesian trade balance was even weaker, this after the country has had continuous surpluses in 2011 and 2012. Finally most emerging markets managed to achieve PMI readings slightly over 50, like e.g. Russia, Mexico or South Africa. This implies that the rest of the world has managed to reduce the difference to the U.S. PMIs.
The logical consequence is that only the Fed’s tapering or alternatively an ECB rate cut are able to stop a weaker dollar.
Swiss data
The SVME PMI weakened to 54.2 after 55.3 in the previous month driven by slight weakness in output. The UBS Consumption indicator improved to 1.56 and was nearly as high as in early 2011, when it reached levels up to 1.91. Probably the most important Swiss leading indicator, the KOF Economic Barometer inched up to 1.72.

source KOF University of Zurich
Weekly FX rates
The clear winner of the week was the US dollar thanks to expectations of earlier tapering and the strong Chicago and ISM PMIs. The potential ECB rate cut took its toll in the currencies that are driven by European demand and inflation, namely the Hungarian florint HUF, the Swedish SEK and the Polish PLN.
Gold, silver, but also emerging market currencies like ZAR, BRL, IDR and INR were hit by the stronger U.S. data. Similarly, the Aussie and the Kiwi inched down this week.
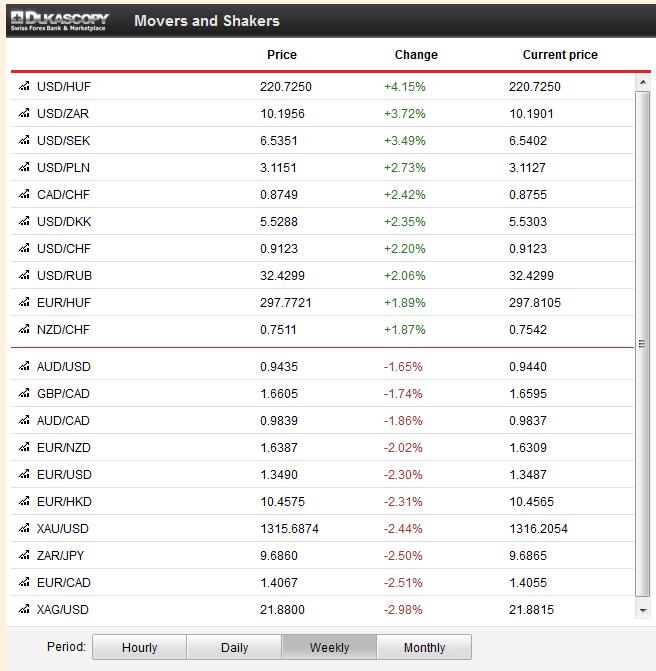
The EUR/CHF had an important change of behaviour: Since risk aversion ebbed, a stronger dollar led to an increase of EUR/CHF. But with the weak euro zone inflation figures on Thursday, CHF improved against EUR and followed the rise of the dollar.
Are you the author?Tags: ECB,European inflation,Federal Reserve,FX news,Germany Retail Sales,Germany Unemployment Rate,Gold,silver,Switzerland KOF Economic Barometer,Switzerland Trade Balance,Switzerland UBS Consumption Indicator,U.S. Case Shiller Home Price Index (Macro),U.S. Chicago PMI,U.S. Crude Oil Inventories,U.S. Industrial Production (ZH),U.S. Initial Jobless Claims,U.S. Retail Sales


