


George Dorgan
My articles My siteAbout meMy videosMy books
Follow on:LinkedINTwitterSeeking Alpha
CFA SocietyEconomicBlogs
Major Fundamental Events
The week contained a lot of important fundamental events, in particular Non-Farm Payrolls and preliminary “flash” PMI readings.
Highest importance for FX rates
- Non-Farm Payrolls (NFPs) weakened to 148K, private NFPs to 126K, both against 180K expected. Especially the private NFPs were disappointing. The decrease in the unemployment rate from 7.3% to 7.2% was driven mostly by declining participation. It showed a little divergence between the household (CPS) survey that indicates the unemlozment rate and the NFP (or CES) survey.
Markit Manufacturing PMI October 2013

click to expand
The upgrade of the previous NFP reading from 169K to 193K was good news, even if it was mostly driven by government jobs. Private NFPs were reviewed upwards only by 9K.
- The Markit Manufacturing “flash” PMI for the United States fell to 51.0. This was the lowest reading since early 2012. Output was contracting and orders slowing, while input prices were rising. The comment of Markit’s Chris Williamson was:
The flash PMI provides the first insight into how business fared against the backdrop of the government shutdown in October, and suggests that the disruptions and uncertainty caused by the crisis hit companies hard. The survey showed thefirst fall in manufacturing output since the height of the global financial crisis back in September 2009. (source Markit)
- Thanks to increasing orders, the HSBC manufacturing “flash” PMI for China rose from 50.2 to 50.9, higher than the 50.5 expected.
- China’s benchmark seven-day repo rates were up nearly a full percentage point at 5 percent after the PBoC declined to inject liquidity. This move was seen as a response to the strong 9.1% YoY increase in Chinese house prices and perceived bubbles in many cities. For us it is interesting to see that the 9% price increase in China is considered a bubble, while the same price hikes are called a “recovery” in the United States. Incomes are rising in China and sustaining higher house prices, but they are flat in the U.S. The house price index from the Economist shows that the Chinese are able to pay higher house prices:

source The Economist
High importance
- The American FHFA house price index rose only by 0.3% MoM after improvements between 0.5% and 1% per month since December. Smaller affordability and the increase in mortgage rates to 4.28% from 3.35% in May took their toll.
- Thanks to growing confidence in China, the German manufacturing flash PMI remained stable at 51.5, while the less China-related French one declined to 49.4. The European services PMI, however, fell to 50.9 vs 52.4 expected.
- The business expectations of the German IFO decreased from 104.2 to 103.6.
- Initial jobless claims in the U.S. were at 350K, higher than the 340K expected.
- The Japanese consumer price index (CPI) for September was up 1.1% YoY , but was mostly driven by higher prices for food, energy and transportation. Prices of goods inched up 2.1% YoY but services only 0.1%. The October values for Tokyo indicated that prices for goods rose only 1.3% YoY and services were unchanged. The Tokyo CPI only improved by 0.6% YoY. If wages, services and local goods do not become more expensive, then the higher import prices will be washed out of the statistics and the CPI will fall to zero again. The corporate services index (CSPI), however, indicated a 0.7% YoY increase.
- British GDP was up 1.5% YoY and 0.8% QoQ.
As The Economist notes, the improvement was driven by spending and the banking sector, but other sectors lagged. The UK recovery is hence unbalanced and possibly not sustainable in the long-term.
- The U.S. trade balance for August came in line with expectations and was nearly unchanged. For us it is disappointing because Americans could not reduce the deficit even if prices for imported oil were lower in August.
Lower importance
Richmond Fed manufacturing index: +1 remains only slightly over contraction, while the Kansas Fed Manufacturing Survey showed a value of +6, better than expected. Companies in Kansas seemingly shrug off the government shutdown.
The Michigan consumer sentiment decreased from 75.2 to 73.2 with the US government shutdown.

The Japanese trade deficit continued to deteriorate, imports were up 16.5% YoY but exports only 11.5%. The Japanese continue their moderate increase in spending, they are not hit by austerity like Europeans and some emerging markets. Rising energy prices took their toll and hit poorer consumers more than wealthy stock owners.
The Australian CPI increased 2.2% YoY, higher than 1.8% expected. With this news, rate hikes seem to be getting more remote.
Both the Norwegian Norges Bank and the Swedish Riksbanks left their key rates unchanged at 1.5% and 1.0%. The Riksbank has currently a dovish bias, while Norges Bank wants to keep rates until mid 2014. With falling Norwegian inflation, this is positive news for NOK/SEK (see more in our recent posts).
Still bad performance in emerging markets: Mexican retail sales -2.2% YoY, -1.4% MoM. Brazilian unemployment increased from 5.3% to 5.4%.
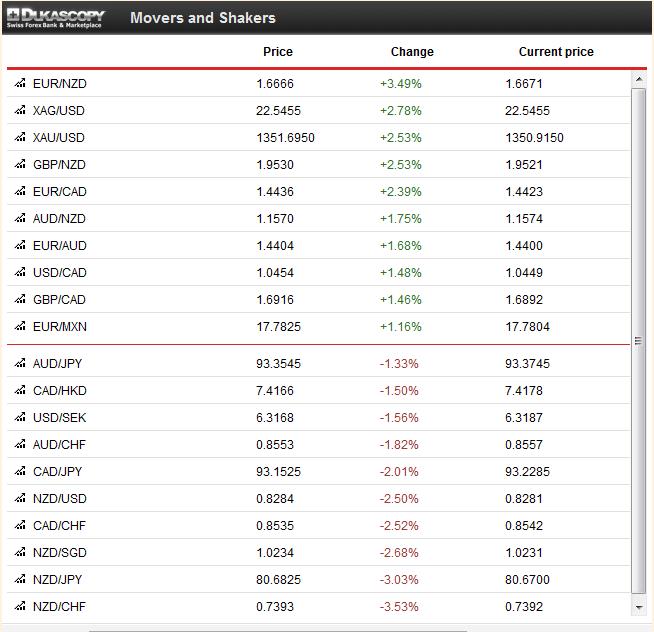
Weekly FX movements
- Thanks to bad U.S. performance, gold and silver outperformed markets. Usually in these cases, silver (XAG) has about twice the performance of gold (XAU). But the PBoC tightening gave gold, the stronger crisis hedge, a relatively stronger performance.
- The euro and the Swiss franc profited most from bad U.S. data and not – as usual- the yen. The Japanese currency was hit by the tightening in neighboring China and the bad Japanese trade data.
- Other currencies of the American bloc, CAD and MXN, weakened with the bad U.S. data.
- The risk-on currencies of the Asian bloc, AUD and NZD, depreciated with the PBoC comments.
- The by far weakest performer was the NZD that was hit hard by the Chinese tightening and negative comments from New Zealand’s government and RBNZ’s Wheeler about the strong currency and possible interventions.
- The CHF was once again the strongest currency this week. USD/CHF inched down 1% from 0.9019 to 0.8926, while the EUR/CHF fell slightly from 1.2344 to 1.2322.
Swiss Economic Events
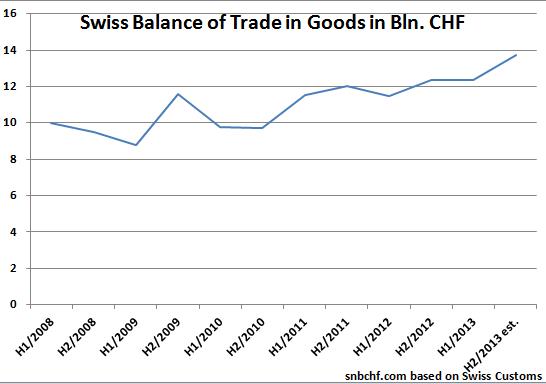
Second half 2013 estimated based on Q3 data
The Swiss balance for trade in goods attained a new record high in Q3/2013 with 6.87 bln. CHF. Thanks to the “artificially suppressed” franc, the exchange-rate sensitive machinery industry achieved a 3.9% increase in exports against Q3/2012, the change from 2011 to 2012 was -9.6% . The food and plastics industry surprised with increases of 7 to 10% YoY, compared to +3.4% (food) and -6.1% (plastics) in 2012.
The usually very strong chemical and pharmaceutical industry lagged with only 2% growth, compared to a rise of 6% in the year 2012. Due to the slowing in emerging markets, sales of watches fell from a 11% increase in 2012 to 4% YoY in Q3/2012.
Are you the author?
Tags: American bloc,Asian bloc,FX news,Gold,Norway Consumer Price Index,silver,Switzerland Trade Balance,U.K. Gross Domestic Product,U.S. Consumer Confidence,U.S. Initial Jobless Claims,U.S. Nonfarm Payrolls,U.S. Trade Balance


