Tag Archive: consumer spending
Retail Sales Weren’t All That Bad, Meaning They Were The Worst
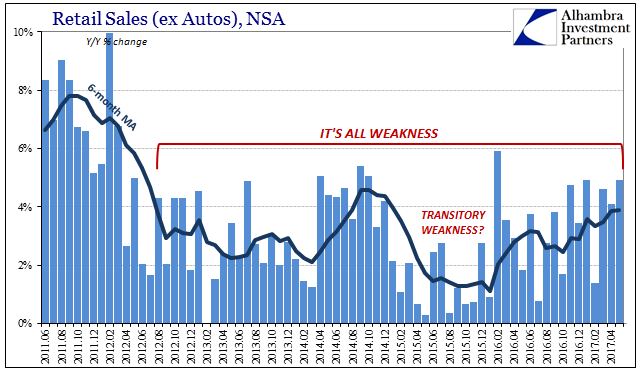
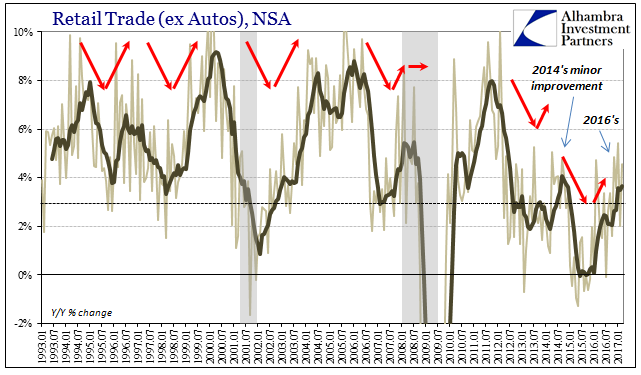
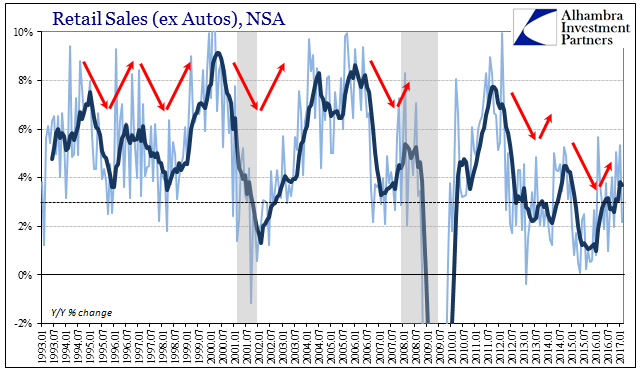
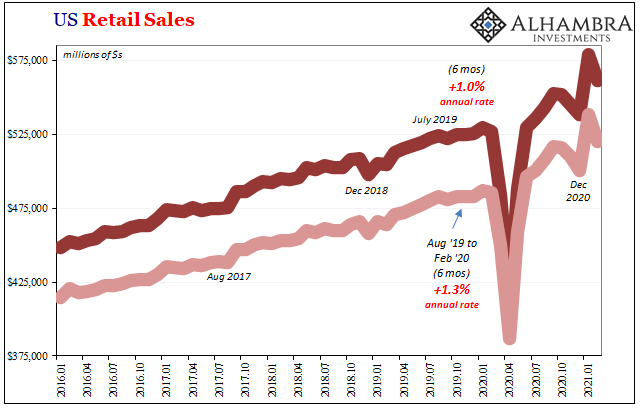
Taken in comparison to the last few years, today’s retail sales report wasn’t that bad. Total sales for May 2017, including autos, grew by 5.17% year-over-year (NSA). That was the highest growth rate since last February. The 6-month average is now just shy of 4%, the best since early 2015. It is clear the US economy has shrugged off the effects of last year’s downturn.
Read More »
Read More »
Wealth Paradox Not Effect
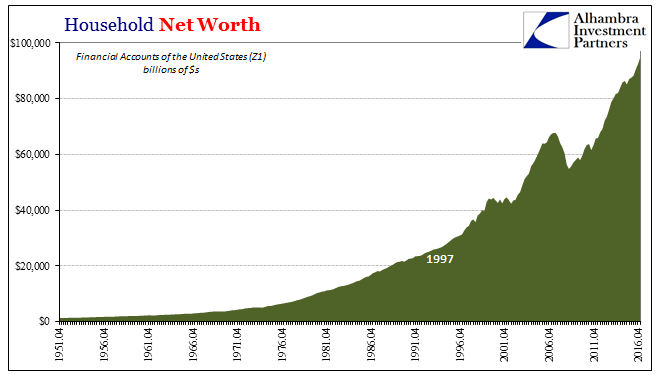
US Household Net Worth rose to a record $94.8 trillion in Q1 2017. According to the Federal Reserve’s Financial Accounts of the United States (Z1), aggregate paper wealth rose by more than 8% year-over-year mostly as the stock market shook off the effects of “global turmoil.” It was the best rate of expansion since the second quarter of 2014 just prior to this “rising dollar” interruption.
Read More »
Read More »
Simple (economic) Math
The essence of capitalism is not strictly capital. In the modern sense, the word capital has taken on other meanings, often where money is given as a substitute for it. When speaking about things like “hot money”, for instance, you wouldn’t normally correct someone referencing it in terms of “capital flows.” Someone that “commits capital” to a project is missing some words, for in the proper sense they are “committing funds to...
Read More »
Read More »
Reasonable Retail (Therefore Consumer) Expectations
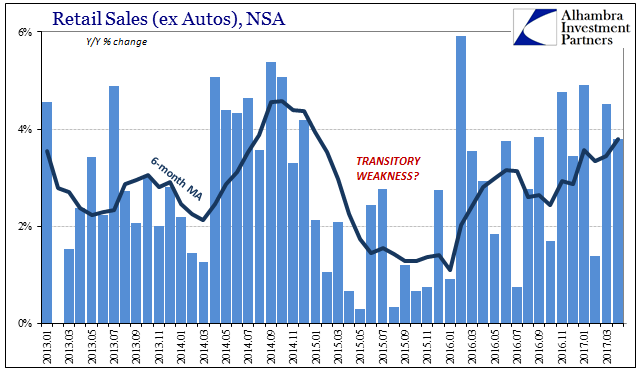
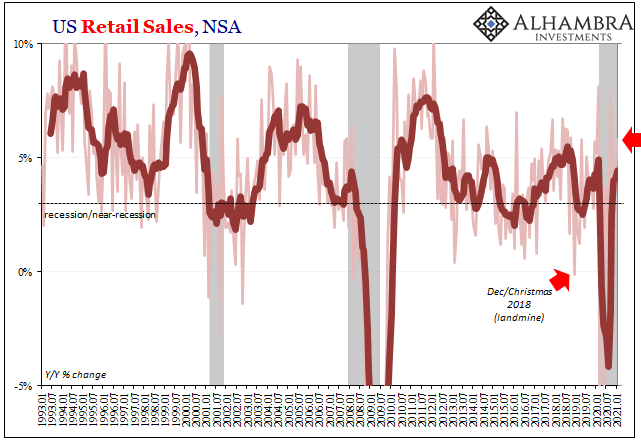
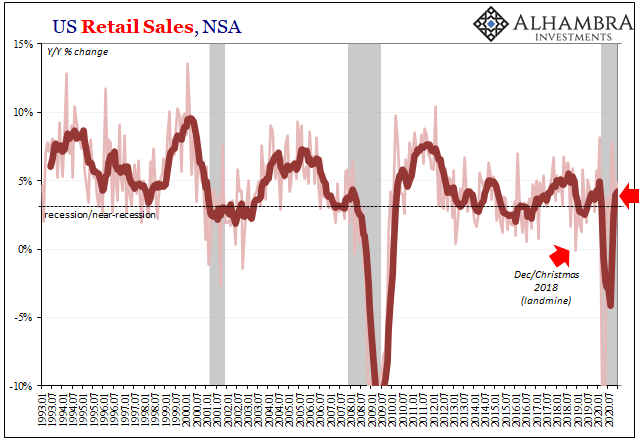
Retail sales estimates are not adjusted for inflation, but even so whenever they get down toward the 3% growth level you can be sure there is serious economic trouble. The 6-month average for overall retail sales dropped below 3% in March 2001, the month that marked the start of the official dot-com recession (though that is not the official name for the cyclical peak, it probably should be).
Read More »
Read More »
Auto Pressure Ramps Up
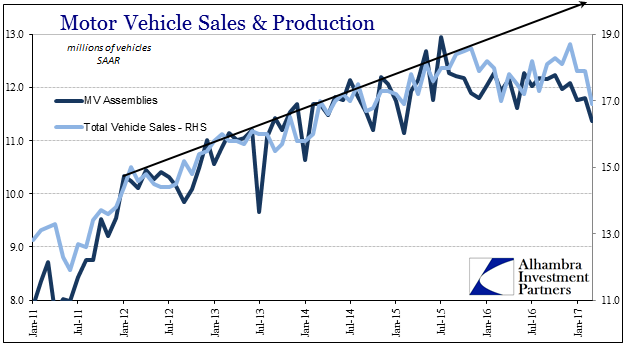
The Los Angeles Times today asked the question only the mainstream would ask. “Wages are growing and surveys show consumer confidence is high. So why are motor vehicle sales taking a hit?” Indeed, the results reported earlier by the auto sector were the kind of sobering figures that might make any optimist wonder.
Read More »
Read More »
The Expanded Retail Sales Gap
Retail sales growth in February 2017 was going to be low by virtue of its comparison to February 2016 and the extra day in that month. The Census Bureau’s autoregressive models are supposed to normalize just these kinds of calendar irregularities so that we can make something close to apples to apples comparisons. The seasonally-adjusted estimate for February, however, was calculated to be less than the one for January 2017, therefore suggesting...
Read More »
Read More »
Assessing China’s Economic Risks
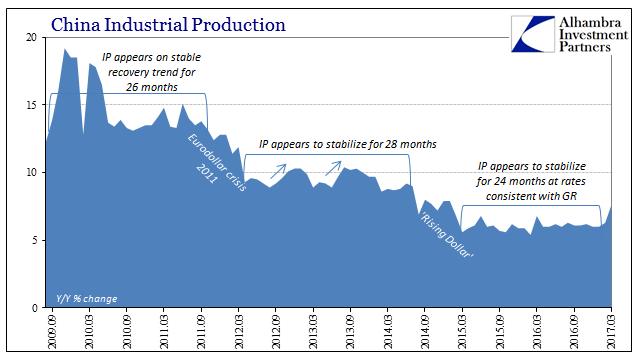
First quarter GDP in China rose 6.9%, better than expected and above the government’s target (6.5%) for 2017. It stands to reason, however, that if Communist officials thought they could get 6.9% to last for the whole year they would have made it their target, especially since 6.5% would be less than the GDP growth rate for 2016 (6.7%). In only that one way is China’s GDP statistic meaningful.
Read More »
Read More »
February US Trade Disappoints
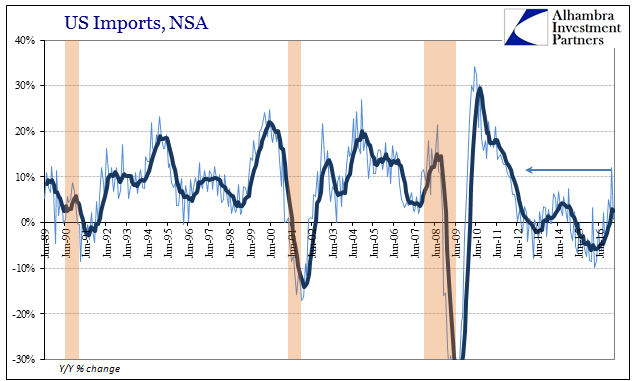
The oversized base effects of oil prices could not in February 2017 push up overall US imports. The United States purchased, according to the Census Bureau, 71% more crude oil from global markets this February than in February 2016. In raw dollar terms, it was an increase of $7.3 billion year-over-year. Total imports, however, only gained $8.4 billion, meaning that nearly all the improvement was due to nothing more than the price of global oil.
Read More »
Read More »
Durable Goods After Leap Year
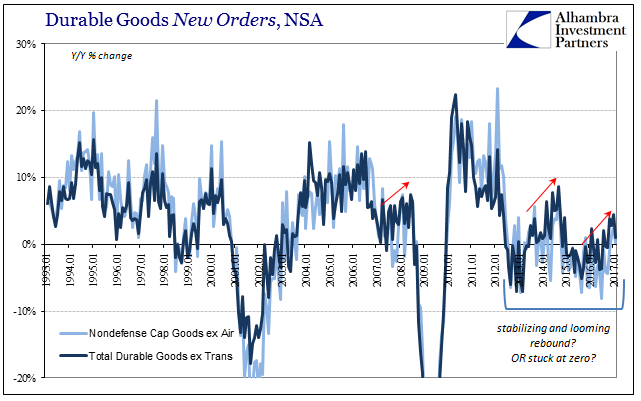
New orders for durable goods (not including transportation orders) were up 1% year-over-year in February. That is less than the (revised) 4.4% growth in January, but as with all comparisons of February 2017 to February 2016 there will be some uncertainty surrounding the comparison to the leap year version.
Read More »
Read More »
Retail Sales: Extra Day Likely, no Meaningful Difference
Retail sales comparisons were for February 2017 skewed by the extra day in February 2016. With the leap year February 29th a part of the base effect, the estimated growth rates (NSA) for this February are to some degree better than they appear. Seasonally-adjusted retail sales were in the latest estimates essentially flat when compared to the prior month (January). That leaves too much guesswork to draw any hard conclusions.
Read More »
Read More »
China Starts 2017 With Chronic, Not Stable And Surely Not ‘Reflation’
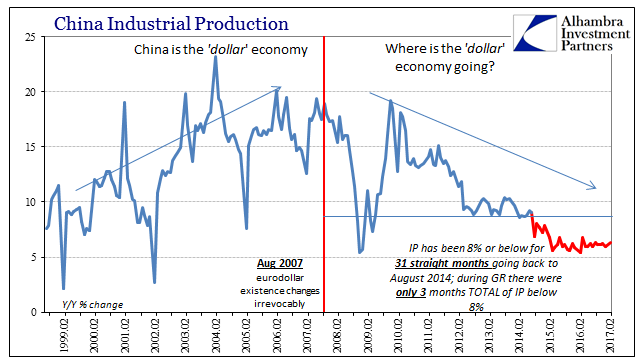
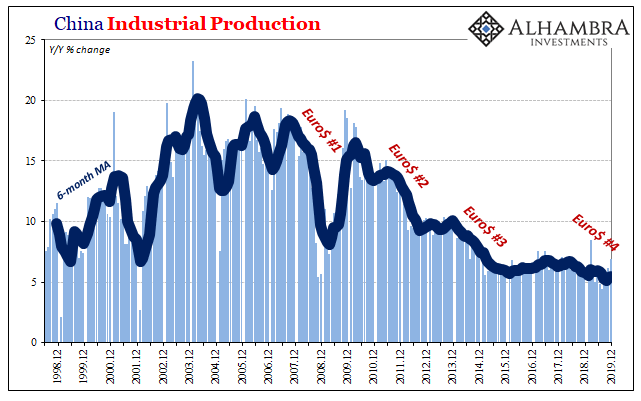
The first major economic data of 2017 from China was highly disappointing to expectations of either stability or hopes for actual acceleration. On all counts for the combined January-February period, the big three statistics missed: Industrial Production was 6.3%, Fixed Asset Investment 8.9%, and Retail Sales just 9.5%.
Read More »
Read More »
Real Disposable Income: Headwinds of the Negative
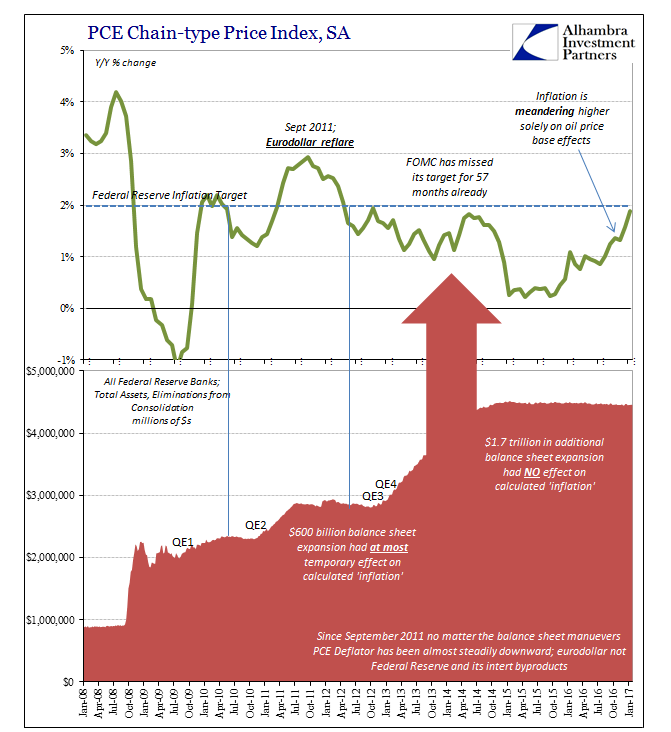
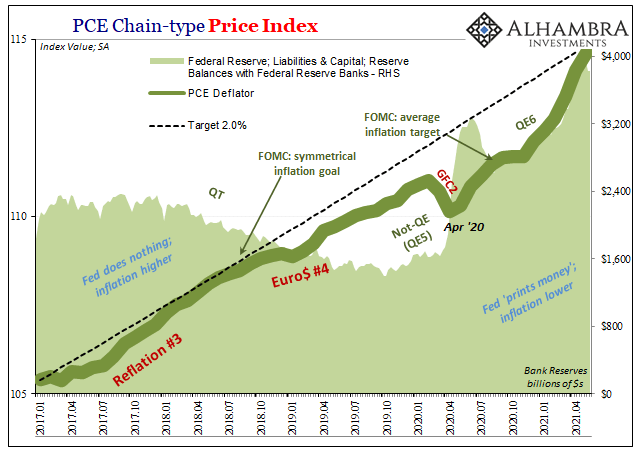
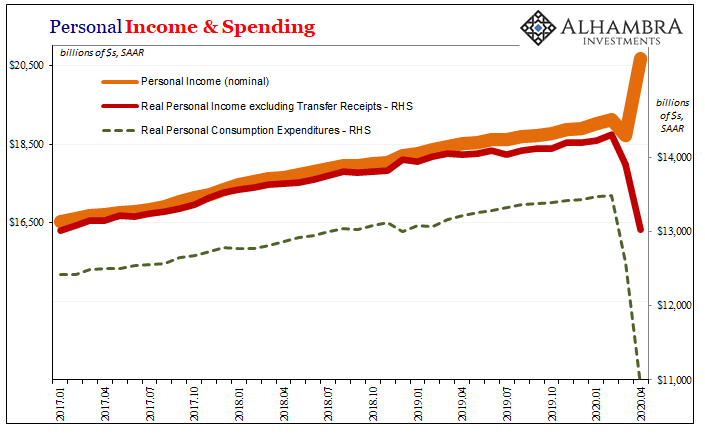
The PCE Deflator for January 2017 rose just 1.89% year-over-year. It was the 57th consecutive month less than the 2% mandate (given by the Fed itself when in early 2012 it made the 2% target for this metric its official definition of price stability).
Read More »
Read More »
Who Has Got the Problem? Europe or Japan?
A couple of months ago the euro traded close to EUR/USD 1.20 and the whole world was betting on its breakdown. Once the euro downtrend ended thanks to QE3, OMT and euro zone current account surpluses, the common currency did not stop to appreciate against the yen and reached levels of EUR/JPY 104 and above. … Continue reading...
Read More »
Read More »
The vicious cycle of the US economy or why the US dollar must ultimately fall again
Just some simple words about the vicious cycle of the US economy and the consequences on the US dollar: A stronger USD will not rescue the US economy, quite the contrary. US companies will not hire in the US, but outsource or hire overseas. If they hire in the US, due to the high number …
Read More »
Read More »
The Chinese Government, a bubble creator or when finally does China consume ?
The years 2009 to 2011 have seen four institutions that created bubbles in commodity, stock and real estate markets. 2008 and 2009 saw the massive Keynesian interventions by the US state and the Chinese government. In 2009 the first Quantitative Easing measures enabled a first flood of hot money into Emerging Markets. Summer 2010 witnessed …
Read More »
Read More »
Forget Non-Farm Payrolls, Take US Personal Disposable Income as Lead Economic Indicator
The unreliable Non-Farm Payrolls has far too much importance Interesting to see that markets needed two relatively bad NFPs to really believe that their main indicators, the “Non-Farm Payroll” reports were strongly biased in January and February by a positive weather effect. HFT algorithms that highly influence stock market prices, are not able to take …
Read More »
Read More »


