| According to the movie The Princess Bride, the worst classic blunder anyone can make is to get involved in a land war in Asia. No kidding. The second is something about Sicilians and death. There is also, I’ve come to learn, an unspoken third which cautions against chasing down and then trying to break down seasonal adjustments in economic data.
Some things are best left just as they are published. |
 . |
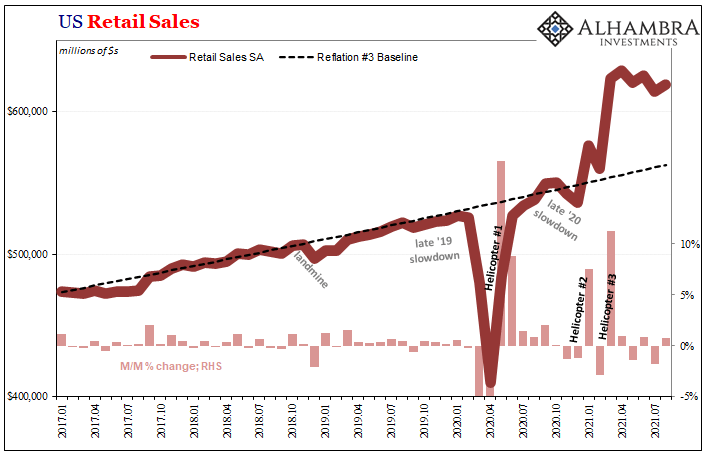
| The Census Bureau today released its estimates for retail sales. Most pay attention only to the seasonally-adjusted version which was surprisingly positive for August 2021 (if after an unusually large downward revision to July). It was widely expected sales would continue to fade, another monthly move downward nonetheless as the last Uncle Sam helicopter likewise fades on the calendar.
Instead, seasonally-adjusted, overall retail sales were calculated to have gained 0.71% from July to August. The implication according to today’s mainstream interpretation seems to be that the last payroll report, the one that missed big, must have been itself a statistical quirk and that consumers as workers are doing just fine. More than fine. |
|
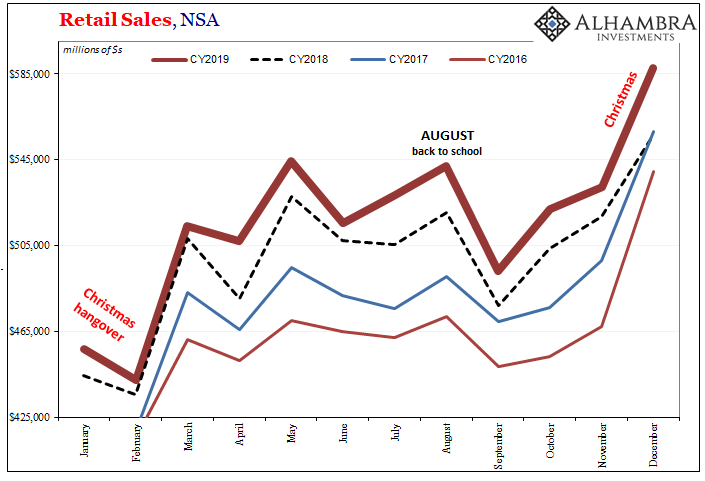
| August just so happens to be one of the key months on the retail calendar, too. In most years, more retail sales happen during it than in even November (Christmas-y December remains always as the big one) as parents pick up as much and many back-to-school supplies and material as they can afford. During normal years, it creates an unmistakable seasonal pattern:
This is, of course, what seasonal adjustments are meant for; to take regular seasonal patterns and translate the unadjusted data into a comparable monthly change apples-to-apples (including counting up the number of weekend days and accounting for changes in when holidays show up). For our immediate purposes, it is normal for unadjusted August retail sales to end up substantially more than July. Therefore, what Census does is try to translate what the “normal” increase from July to August must be, and then compare the unadjusted current data to that estimate to come up with the seasonally-adjusted figure. In other words, hypothetically, if each year the average change from July to August due to seasonality is, say, 0.5%, then in any year where the actual unadjusted increase one month to the next is 0.7%, the seasonally-adjusted figure would be put down as better than “normal.” What would it be, however, if unadjusted retail sales were thought to be less in whichever August compared to July? |
|
| You wouldn’t then expect the month-over-month change in the seasonally adjusted data to be relatively high, or even positive.
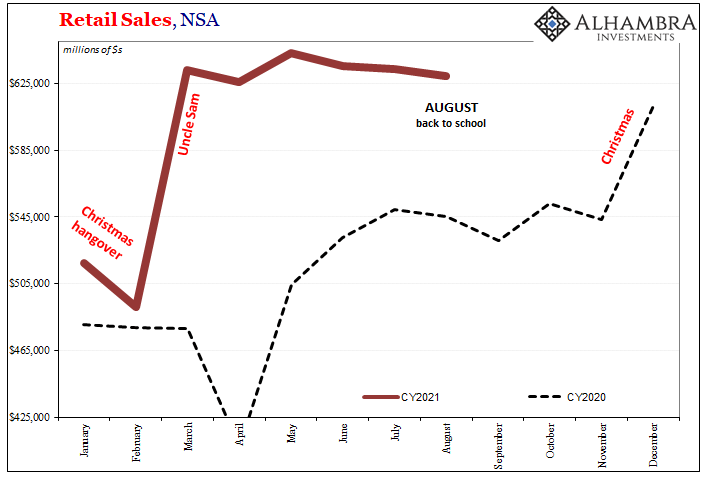
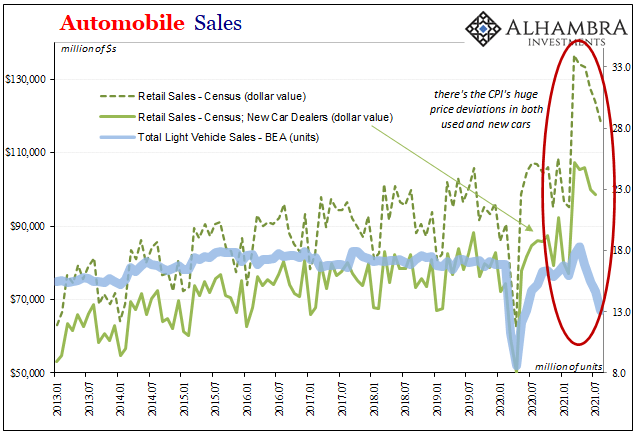
Census data in each of the past two years, 2020 and now 2021, produce that very outcome. For both, August retail sales ended up less than July on an unadjusted basis. When the seasonal adjustments are then applied, magically August is much better – including August 2021 which “everyone” expected to be less but is now transformed into inflation-is-back-on-the-table awesome. In fact, the month-over-month increase for this August (+0.71%) is almost identical to last August’s +0.81%. How? I have no idea. To be perfectly clear, there is no conspiracy here nor am I suggesting anything other than the simplest explanation. The data may be easily confused (see: autos) because these are atypical times. What that would mean is far less assured accuracy especially when it comes to seasonally-monkeyed estimates. Whenever any data series breaks from long-established precedent (like, say, the participation rate and its effect on the unemployment rate), there’s potentially some trouble figuring out the other numbers related to it. To go further on the data discontinuities, Census believes that retail auto sales were still huge last month, unadjusted at 10% more than last August while 11% better than August 2019. Immensely booming car sector. |
|
| The BEA, on the other hand, as we’ve been looking at for more than year, this other government agency figures that there were only 13.057 million (SAAR) units sold in the same month.
While it doesn’t account for price changes, still this other was an incredibly low number (blamed on low inventory created by production choked off by the menacing microchip shortage) more than 14% less than the estimated number of units sold in August 2020, and a ridiculously different 24% below August 2019. Something is clearly way off with at least one set of these estimates, and by all anecdotal accounts it has to be Census (though could be both). In the end, all this may just be splitting hairs anyway because 1. Retail sales remain elevated even if we aren’t exactly confident by how much; 2. They are, over several months, generally fading as expected; 3. In August with renewed delta fears it just may be that some spending on goods came at the unexpected expense of spending on services, which has been the trade-off for much of the pandemic period (and we’ll have to wait for BEA PCE figures later this month to confirm). Still, this is one of those crucial months (I know, they all seem crucial when they happen) when some legit accuracy might be extremely helpful. It could just be that August retail sales is an outlier, statistical or real, which wouldn’t be unusual. |
The reason chasing seasonally-adjusted monthly data is often a fool’s errand is that, as any statistician will tell you, short run changes to high frequency data are already pretty unreliable at any time.
And that means putting too much stock in any single one isn’t a good idea. Only just slightly worse than committing to fight on the ground across the Far East.
It’s the trend what matters, and even with the August retail sales surprise it doesn’t really alter it. But you have to wonder what would be said, and what will be said next week, if the stats weren’t this messed up.
Full story here Are you the author? Previous post See more for Next postTags: consumer spending,currencies,economy,Featured,Federal Reserve/Monetary Policy,Markets,newsletter,Retail sales


