Tag Archive: Australia
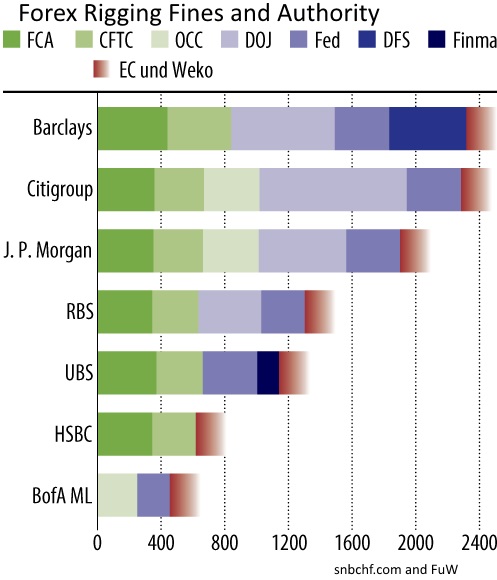
The SNB and the Forex Rigging Irony
While Forex banks, traders, and other institutions are being blamed for market rigging, the Swiss National Bank can publish reports about its own market rigging, but instead of being a scandal, it's economic data. That's because the vast majority do...
Read More »
Read More »
Net National Savings, Part two: The Consumption-Driven Economies
The second part on Net National Savings in % of gross national income, our preferred alternative indicator to GDP. This part contains the consumption-driven economies, which are Latin America and our Western countries
Read More »
Read More »
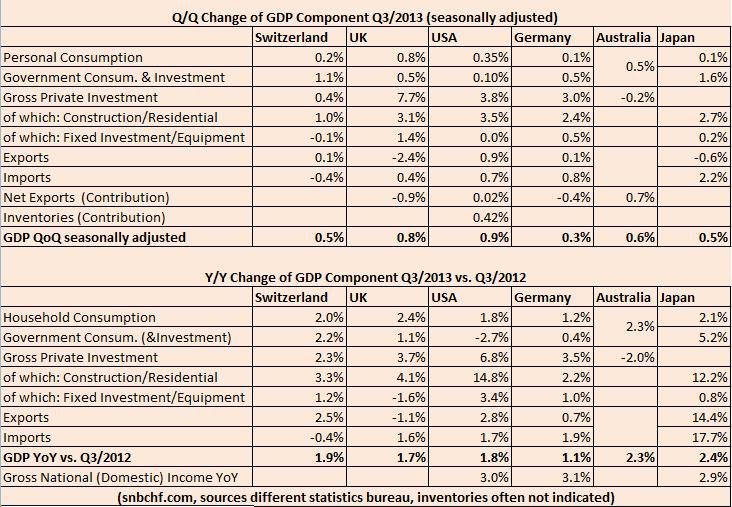
Swiss GDP Details Compared to UK, USA, Germany, Japan and Australia, Q3 2013
The Swiss GDP was again one of the strongest major economies. The quarterly growth rate in the third quarter was 0.5%, the yearly one 1.9%. U.S. GDP improved by 3.6% QoQ annualized. For comparison purposes, our figures are not annualized; hence the equivalent is 0.9% QoQ. In Japan and Switzerland private consumption rose by 0.1% … Continue reading...
Read More »
Read More »
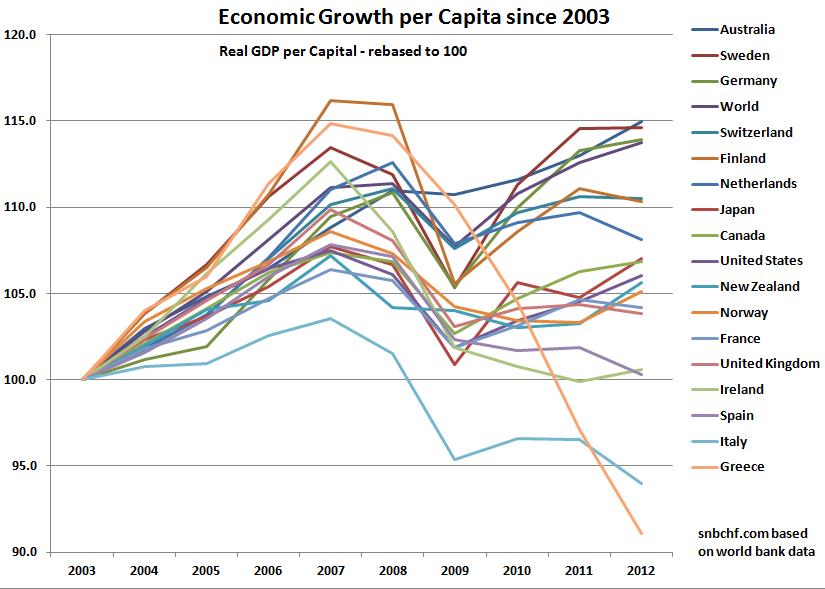
Japan Beats the United States in GDP Growth per Capita for Last Decade
GDP Growth per Capita in Developed Nations in the following order: Australia Sweden Germany Switzerland Netherlands Japan Canada United States France United Kingdom Ireland Spain Italy Greece
Read More »
Read More »
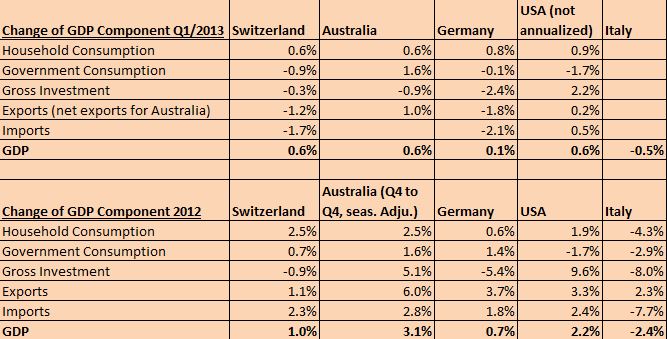
Q1 GDP: Japan +1.0%, AUS, Swiss +0.6%, US +0.45%, Germany +0.1%, Italy -0.5%
Update June 26: The Swiss economy has grown more quickly than the United States in Q1 2013. Japan is in the lead of the global comparison with 1.0% quarterly growth, Australia and Switzerland follow with 0.6%, the US has 0.45% QoQ (or 1.8% annualized), Germany 0.1% and Italy slowed by -0.5%. Weakest currency, strongest … Continue...
Read More »
Read More »
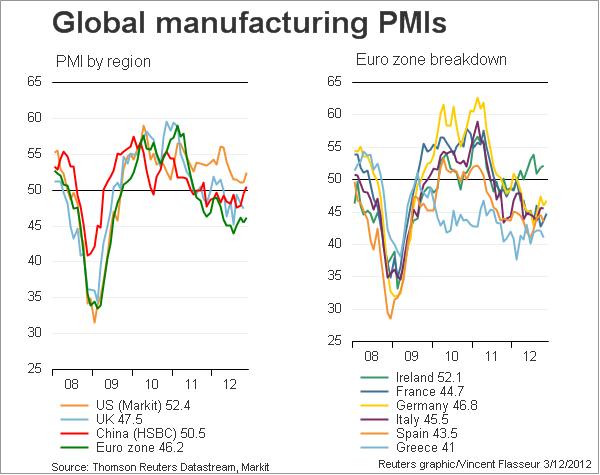
Global Purchasing Manager Indices
Manufacturing Purchasing Manager Indices (PMIs) are considered to be the leading and most important economic indicators. August 2013 Update Emerging markets: Years of strong increases in wages combined with tapering fears have taken its toll: Higher costs and lower investment capital available. EM Companies have issues in coping with developed economies. Some of them …
Read More »
Read More »
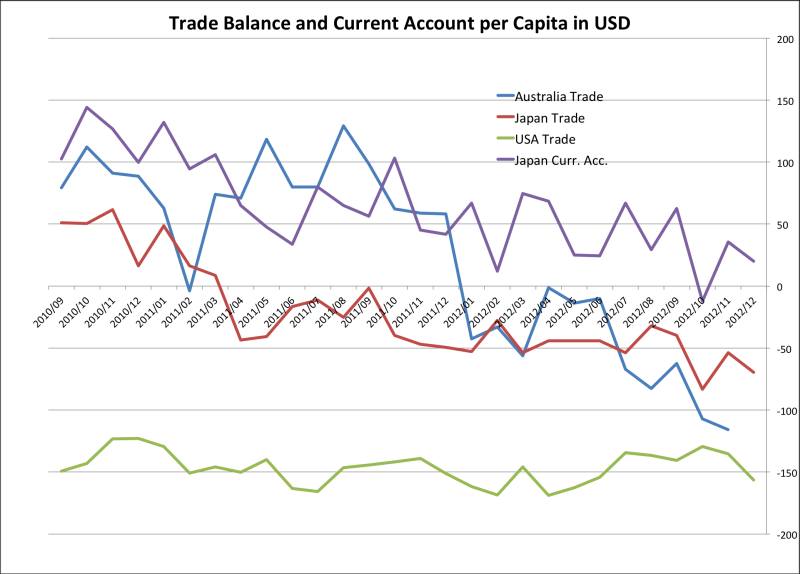
Japanese Currency Debasement, Part 1: Current Account and Japanese Bond Bears
In our first part on Japans currency debasement, we look on three aspects, government bond yields, current account balances and potential hyper-inflation which causes yields to rise strongly.
Read More »
Read More »
Global Purchasing Manager Indices, Update January 25
Manufacturing PMIs are considered to be the leading and most important economic indicators. After a strong slowing in summer 2012 and the Fed’s QE3, this is the fourth month of improvements in global PMIs January 25th Expansion-contraction ratio: There are 15 countries that show values above 50 and 14 with values under 50. Positive-negative-change ratio: …
Read More »
Read More »
Global Purchasing Manager Indices, Update December 17
Manufacturing PMIs are considered to be the leading and most important economic indicators. Since the Fed’s QE3, this is the third month of improvements in global PMIs after a strong slowing in summer 2012. January 25th Expansion-contraction ratio: There are as many countries that show values above 50 as under 50. Positive-negative-change ratio: 18 countries …
Read More »
Read More »
Global Purchasing Manager Indices, Update December 10
Manufacturing PMIs are considered to be the most leading and important economic indicators. Jim O’Neill, Chairman of Goldman Sachs Asset Management, believes the PMI numbers are among the most reliable economic indicators in the world. BlackRock’s Russ Koesterich thinks it’s one of the most underrated indicators. Global Purchasing Manager Indices for the manufacturing industry December 3, 2012 …
Read More »
Read More »


