George Dorgan
My articles My siteAbout meMy videosMy books
Follow on:LinkedINTwitterSeeking Alpha
CFA SocietyEconomicBlogs
The Swiss GDP was again one of the strongest major economies. The quarterly growth rate in the third quarter was 0.5%, the yearly one 1.9%. U.S. GDP improved by 3.6% QoQ annualized. For comparison purposes, our figures are not annualized; hence the equivalent is 0.9% QoQ.
In Japan and Switzerland private consumption rose by 0.1% and 0.2% in Q3. This is far weaker than in the first half of the year when consumption increases in these two countries were higher than in the US or the UK. A reason why Americans and Brits are spending more now, might be the wealth effect: Home prices are increasing in these two countries; furthermore they are more invested in stocks. Japanese, Swiss or Germans are more conservative.
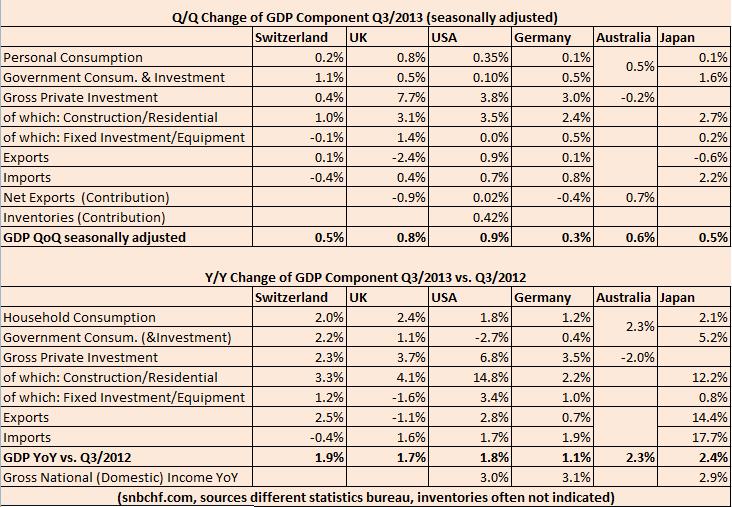
On a yearly basis the Swiss GDP appears well balanced between consumption (+2% YoY), investment (+2.3%) and a still increasing trade surplus. The construction boom has calmed down compared to 2010/2011.
Growth in the U.S. and even more in the UK is unbalanced: GDP is influenced mostly by a new construction boom, by inventories and for the UK by higher spending. As opposed to the UK, the U.S. has reduced the trade deficit, strongly aided by positive terms of trade: especially imported oil was cheaper. After a first phase of strong spending in the second half of 2012, Americans reduced their consumption expenditures, it seems that in the first phase mostly home and stock owners profited, but the other part of the population did not. The savings rate has risen from 4.7% to 5.0% in Q3, which is still lower than the German one of 8.5%.
We are skeptical because investments in the UK and the U.S. are driven by housing/construction while equipment and fixed investments are barely increasing. Economists have proven that house price appreciation and higher interests may crowd out commercial and industrial lending and investments.
As usual Germans continued to spend less (+1.2% YoY) than many economists consider it necessary. The recent uptick in private investment (+3.5%) together with 0.6% increasing employment levels points to rising incomes and could foster spending later. For the first time after years, German imports rose significantly more than exports. As visible in the strong Gross National Income appreciation of +3.1% and higher wages of 2.6%, Germans are able to afford it. But that despite low German spending, net trade was negative, indicates that some trading partners spend even less.
Australia has recently experienced a switch of growth drivers. Previously the economy was influenced more by investment (e.g. in the mining sector) and spending. But in recent quarters the Australians managed to reduce their trade deficit, trade has become a growth driver. The continuing housing boom in China and in the U.S. strengthened demand (i.e. quantity) for copper and other commodities. Unfortunately Australian terms of trade are weaker (-3.6%), because imported Brent oil prices are relatively stable, while prices for other commodities are lower. This is an important difference to New Zealand, that profits on globally rising demand of dairy and other agricultural products and on the still strong Australian demand.
In Japan fixed capital investments have risen only by 0.8%, businesses are not investing and wages have remained stable. Instead the Japanese government did high public investments – a measure that was successful during the Japanese balance sheet recession. In the last decade Japanese gross capital formation to GDP was between 20 and 23%, higher than the 15 to 20% for Germany, the UK and the U.S (data world bank); missing infrastructure might have slowed the U.S. economy. This might be a factor why Japan had higher GDP per capita growth than the U.S. or the UK during this period.
Recently higher Japanese construction investments, foreign portfolio inflows and the boom of the NIKKEI, however, point to an end of the balance sheet recession. Therefore the latest increase of 5.2% government expenditures seems for us excessive.
How did FX markets judge
FX markets have tend to incorporate GDP changes in the weeks before and during the GDP releases. For comparison we use the monthly change:
CHF (FXF) + 1.91%
GBP (FXB) +1.24%
EUR (FXE) + 1.21%
NZD -1.75%
JPY (FXY) -1.90%
AUD (FXA) – 3.46%
Markets seem to focus on the European improvements and the lower investments in Australia. The overvaluation of AUD and NZD are diminishing.
Here the full details in the pages of the Statistics Bureaux:
Germany, Destatis (German)
Switzerland, SECO
United States, BEA
UK, ONS
Japan, Statistics Bureau
Australia, Statistics Bureau
Are you the author?
Tags: Australia,German Imports,Japan,Switzerland,Switzerland Gross Domestic Product,U.K.,United States