Found 1,382 search results for keyword: label
Great Graphic: Odds of President Trump Rise (Predictit)
TRUMP . USPREZ16 This Great Graphic is a 90-day history of the “betting” at PredictIt that Trump becomes the new US President. With Cruz suspending his campaign, the odds of Trump have risen just above 40%. The US national interests and challenges to those interests do not change much from year-to-year, and this may help …
Read More »
Read More »
Great Graphic: Measuring Cost of Extend and Pretend
There is a debate. On one hand is Summers, who argues that modern economies have entered an era of secular stagnation. Full utilization of the factors of production and particularly capital and labor is not possible without stimulating aggregate demand in a way that facilitates bubbles. The broad strokes of the argument can be found …
Read More »
Read More »
Great Graphic:Is that a Head and Shoulders Top in Gold?
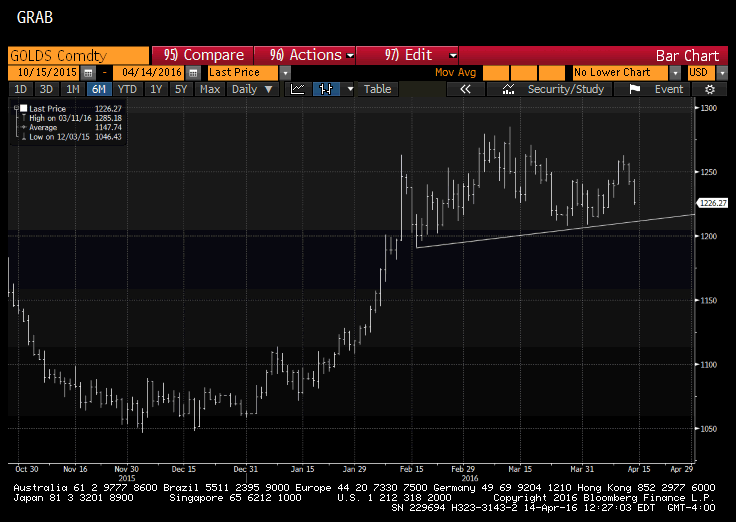
This Great Graphic, created on Bloomberg shows the price of gold over the last six months. The price peaked a month ago near $1285. It seems a distribution top is being formed.
Specifically, it looks like a potential head and shoulders to...
Read More »
Read More »
Great Graphic: Beware of Sophistry about the Yen and Nikkei
There is a common ploy used by many analysts and reporters that often simply does not stand up to close scrutiny, and would in fact be mocked in the university. The ploy is to take two time series and put them on the same chart but use different scales. Such a ploy often is used … Continue reading »
Read More »
Read More »
Gold Stocks Break Out
No Correction Yet Late last week the HUI Index broke out to new highs for the move, and so did the XAU (albeit barely, so it did not really confirm the HUI’s breakout as of Friday). Given that gold itself has not yet broken out to a new high for th...
Read More »
Read More »
Great Graphic: Nonperforming Loans, Another Divergence
Early in the financial crisis, the US forced all large banks to take an infusion of capital. This helped put a floor under the US financial system. Regulators and stakeholders encouraged US banks to address the significant nonperforming loan problem. The eurozone banking woes persist. Before the weekend, the shares of the one the …
Read More »
Read More »
Great Graphic: WSJ survey of Fed Expectations
This Great Graphic shows the results of the last three Wall Street Journal survey of business and academic economists on the outlook for Fed policy. The key take away is that despite all the talk and ink spilled on the shifting Fed stance and the split within the FOMC, economists views did not change much … Continue...
Read More »
Read More »
Great Graphic: Head and Shoulders in Dollar-Yen
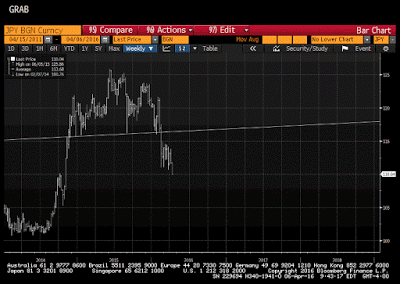
The old head and shoulders pattern in the dollar against the yen is back in vogue. We first pointed it out in the first week of January here.
Recall the details. The neckline is drawn around JPY116.30 and measuring objective is near JPY107.00....
Read More »
Read More »
Great Graphic: Bottom Building on CRB Commodity Index?
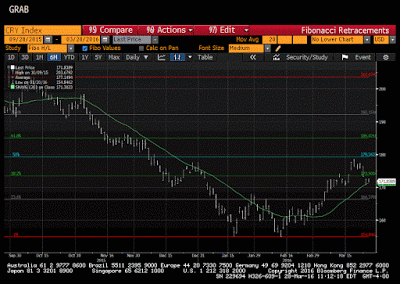
Marc Chandler shows that after the commodity currency Canadian Dollar, also the CRB Commodity index could have found a bottom. See here his Great Graphic on the CAD bottom buildung. See also the CAD resilience despite falling oil prices.
Read More »
Read More »
Great Graphic: Has the Canadian Dollar Bottomed Out?
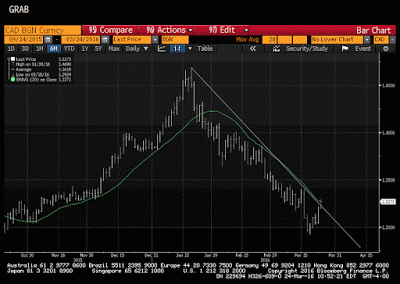
We have been looking for a bottom in the US dollar against the Canadian dollar. It is been difficult, but now it appears that the technicals are turning. This Great Graphic, from Bloomberg, shows that the US dollar is moving above a trend line...
Read More »
Read More »
Great Graphic: Brexit Fears Boost Sterling Put Buying
The UK referendum is three months away. Three-month options are a common benchmark for various market segments; from speculators, to fund managers to corporations. Events over the past week have raised the risks that the UK votes to leave the EU. The market has responded forcefully today, and even if you only follow the spot …
Read More »
Read More »
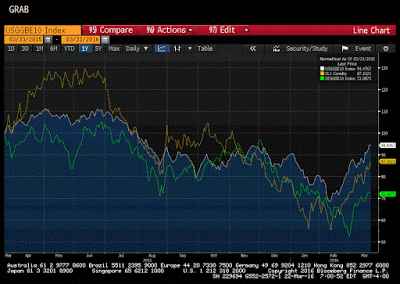
Great Graphic: 10-Year Break-Evens and Oil
Until last September, the Federal Reserve seems to play down the market-based measures of inflation expectations, preferring the surveys that showed views were anchored. At the September 2015 FOMC meeting where the Fed had been expected to tighten until the August turmoil, officials cited among other considerations, the decline in market-based measures of inflation expectations. …
Read More »
Read More »
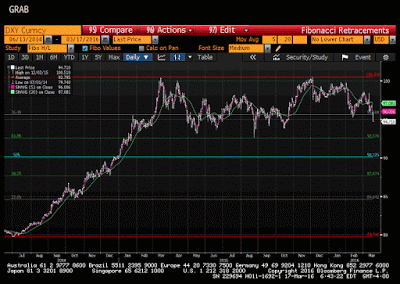
Great Graphic: Dollar Index Retracement, Too Soon To Say Top is In
The cry that the dollar has peaked is gaining ground. We are not convinced. The macro-fundamental case remains intact. Divergence between the US and other high income countries continues, even if at a more gradual pace than the Federal Reserve expected a few months ago. This Great Graphic of the Dollar Index, created on Bloomberg, …
Read More »
Read More »
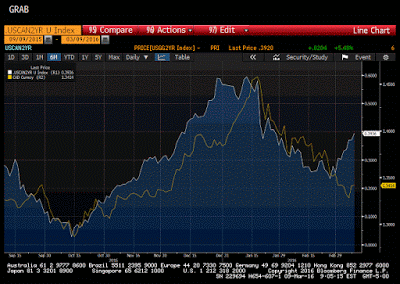
Great Graphic: Vulnerability of the Canadian Dollar
The Canadian dollar appears vulnerable. It remains firm while the US two-year premium over Canada has risen sharply. Like others, we do not expect the Bank of Canada to cut rates today and are looking past it. This Great Graphic was composed on Bloomberg. It shows the 2-year spread (white line) and the US dollar …
Read More »
Read More »
Great Graphic: US 2-year Premium over Germany and Japan at New Cyclical Highs
We argue that the dollar is in its third significant rally since the end of Bretton Woods in 1971. The Reagan dollar rally was driven by the policy mix of tight monetary policy and loose fiscal policy. The G7 effort to stop the dollar's appreciation at the Plaza Hotel in September 1985 marked the end … Continue...
Read More »
Read More »
Great Graphic: Inflation Expectations via 10-Year Breakevens
Over the next fortnight the major central banks, including the ECB, BOJ, Fed and BOE will hold policy-making meetings. Of the four, expectations are the highest for the ECB to ease policy. Given the poor economic data, including deflationary pressures, and the tightening of financial conditions, the BOJ could also adjust policy. However, after the …
Read More »
Read More »
Great Graphic: Surplus Capacity is not the Same as Insufficient Aggregate Demand
Many economists argue that the key challenge is that of insufficient aggregate demand. That is why world growth is slow. Hobbled with debt, households have pulled back. Business investment is weak. Government dissavings has been offset by household and business savings. The solution offered by some economists is a large public investment program. The G20 …
Read More »
Read More »
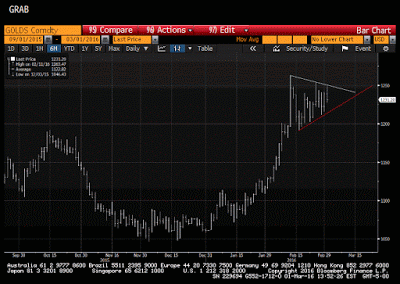
Great Graphic: Gold Triangle–Continuation or Reversal Pattern?
During a period in which the zero bound no longer is the floor of interest rates, and many central banks continue to ease policy, we have been watching gold a bit closer. In early January, we noted that the technical pattern warned of breakout. Our first objective was $1110-$1135. In early February, we updated our …
Read More »
Read More »
Central Banks Shiny New Tool: Cash-Escape-Inhibitors
Submitted by JP Koning via Moneyness blog,
Negative interests rates are the shiny new thing that everyone wants to talk about. I hate to ruin a good plot line, but they're actually kind of boring; just conventional monetary policy except in negative ...
Read More »
Read More »
Great Graphic: Trade-Weighted Look at Major Currencies
When considering the impact of changing currency prices on an economy, trade-weighted measures are appropriate. The Federal Reserve has cited the dollar's appreciation as a headwind on the economy and a depressant on prices.
Given the moves in...
Read More »
Read More »


