


A couple of weeks ago an article appeared on Bitcoin Magazine entitled ‘Some economists really hate bitcoin’. I read it with a sigh of nostalgia. As someone who has been writing about gold for a few years, I am used to reading similar criticisms as those bitcoin receives from mainstream economists, about gold.
Read More »
Found 1,387 search results for keyword: label
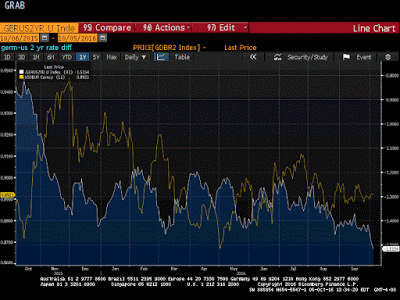
Great Graphic: US-German 2-Yr Differential and the Euro
Read More »
20 Gram Gold Bar | PAMP Suisse | Money Metals Exchange

Read More »
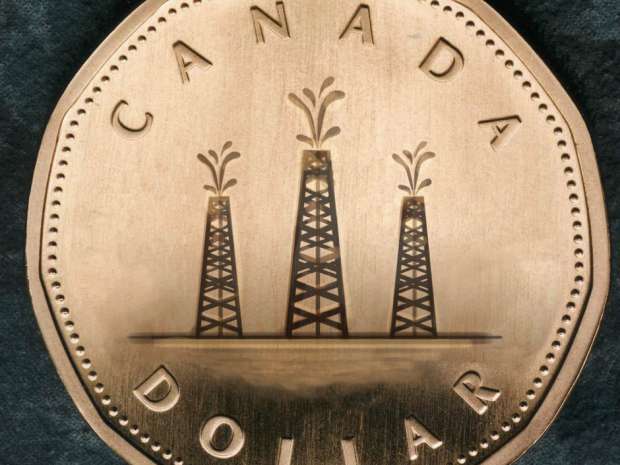
Canadian Dollar: A Little Less About Oil, a Little More about Rates
Read More »
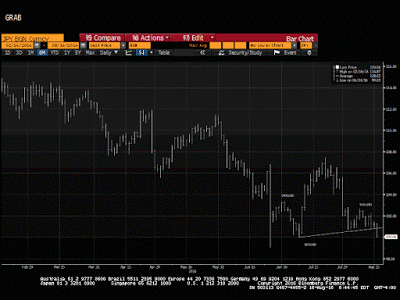
The Yen in Three Charts

Read More »
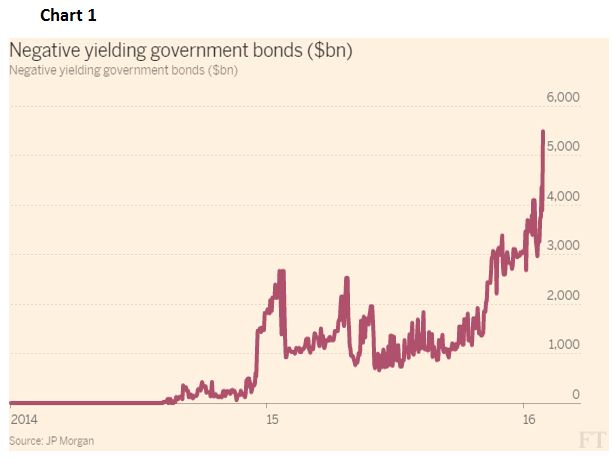
Understanding Negative Interest Rates
Read More »
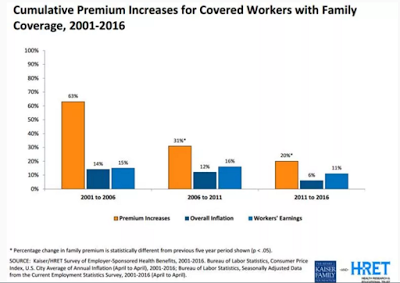
Great Graphic: Growth in Premiums of Employer-Sponsored Health Insurance
Read More »
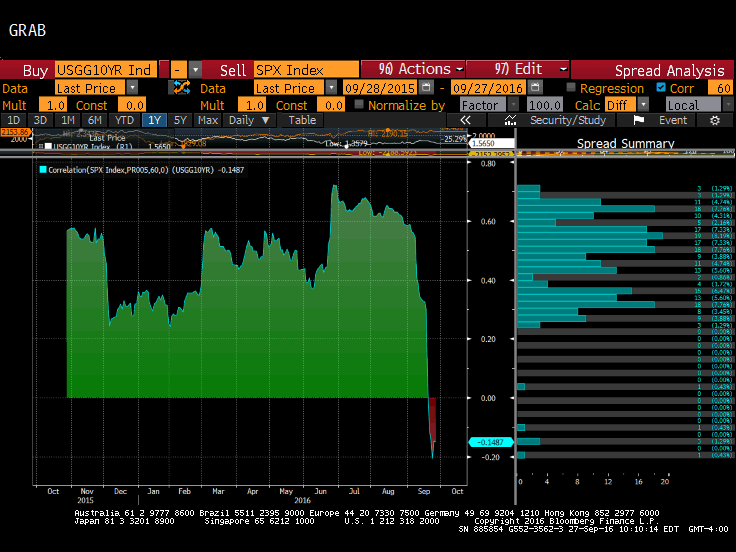
Great Graphic: Stocks and Bonds
Read More »
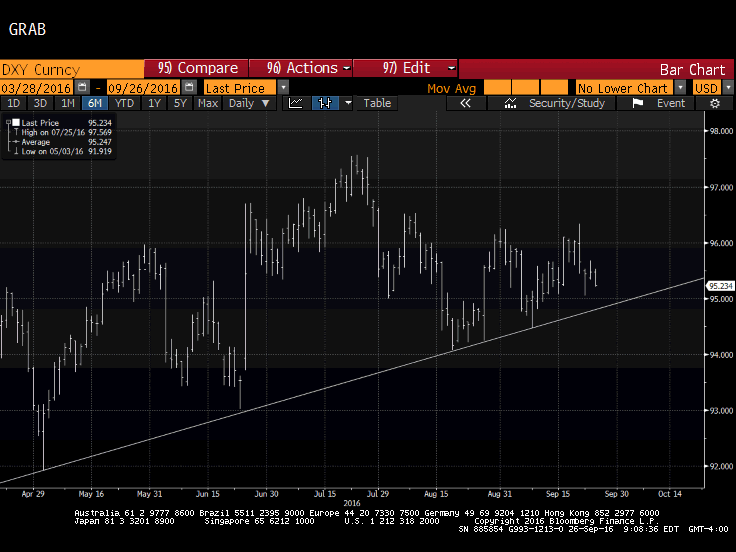
Great Graphic: Nearly Five-Month Uptrend in the Dollar Index Set to be Tested
Read More »
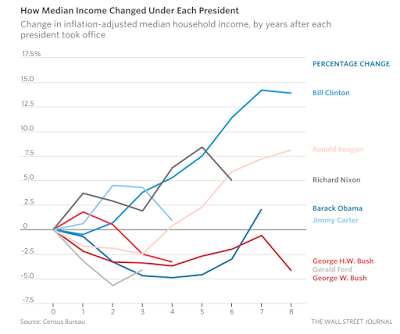
Great Graphic: Median U.S. Income per Presidents
Read More »
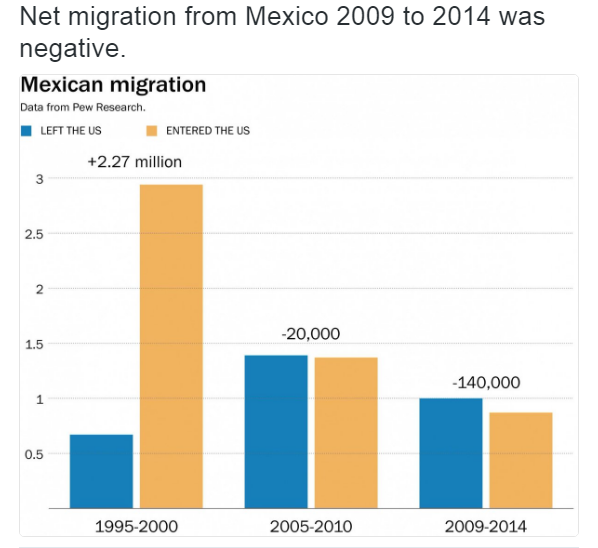
Great Graphic: Net Mexican Migration to the US–Not What You Might Think
Read More »
Negative and the War On Cash, Part 2: “Closing The Escape Routes”
Read More »
Great Graphic: What Kind of Jobs is the US Creating
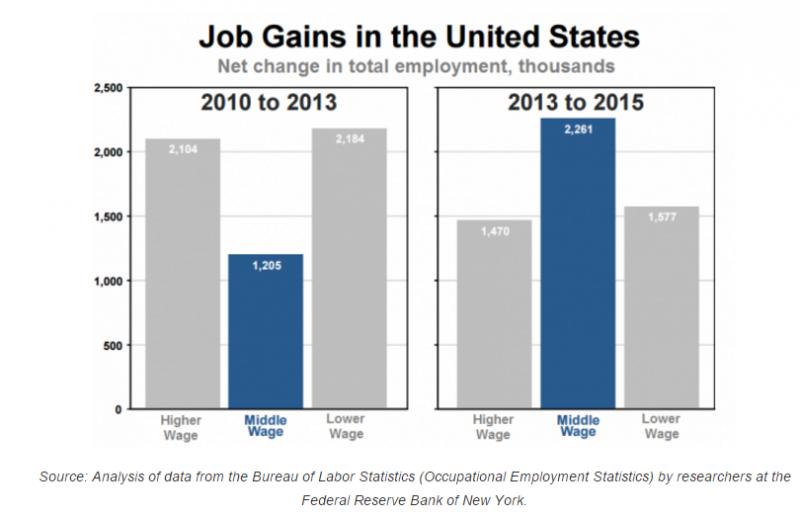
Read More »
Great Graphic: Low Wages in US Rising
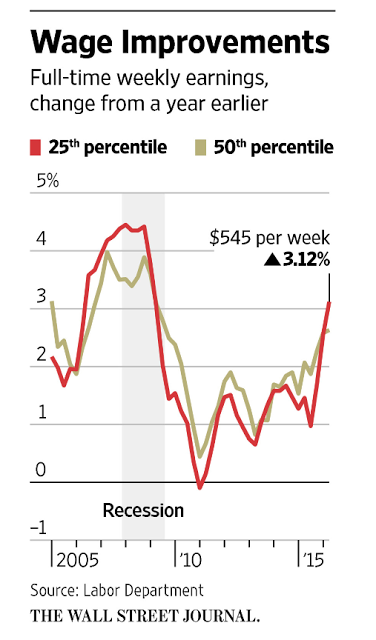
Read More »
Great Graphic: GDP Per Capita Selected Comparison
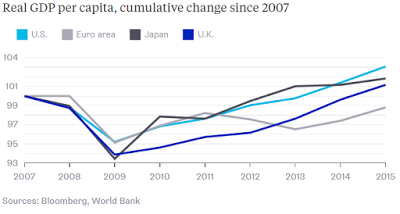
Read More »
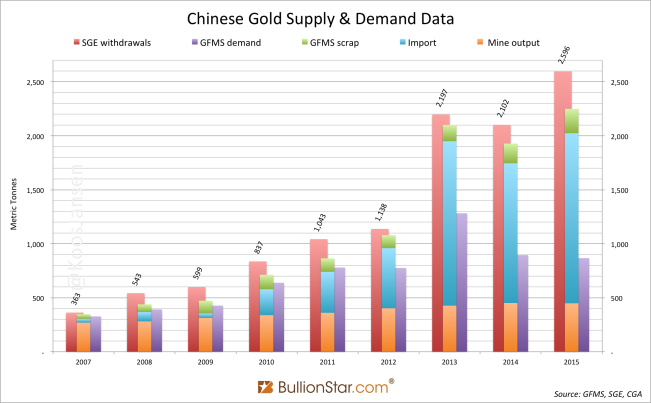
Spectacular Chinese Gold Demand Fully Denied By GFMS And Mainstream Media
Read More »
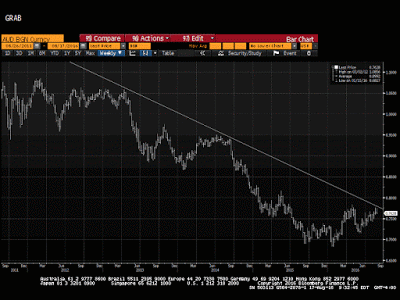
Great Graphic: Aussie Tests Three-Year Downtrend
Read More »
Great Graphic: Dollar-Yen–Possible Head and Shoulders Continuation Pattern
Read More »
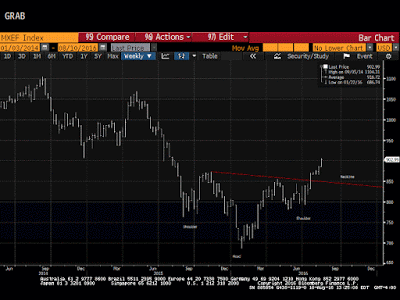
Great Graphic: Bullish Emerging Market Equity Index
Read More »
No Fines for Iberia, but Remedial Action Demanded and Possible Loss of Some ESI Funds

Read More »
 On Swiss National Bank
-
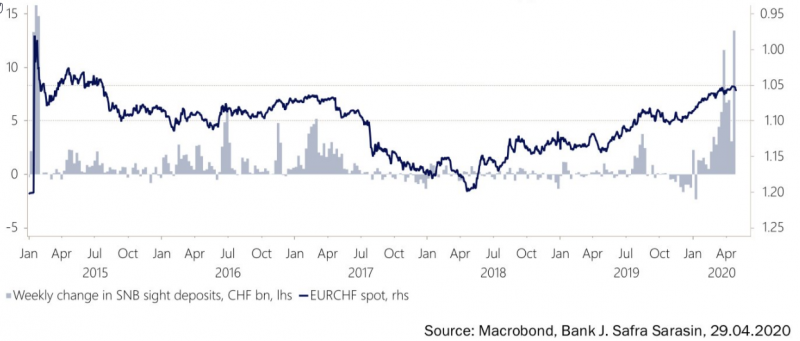
SNB Sight Deposits: decreased by 4.3 billion francs compared to the previous week
-
USD/CHF stays above 0.9100 nearing the highs since October
-
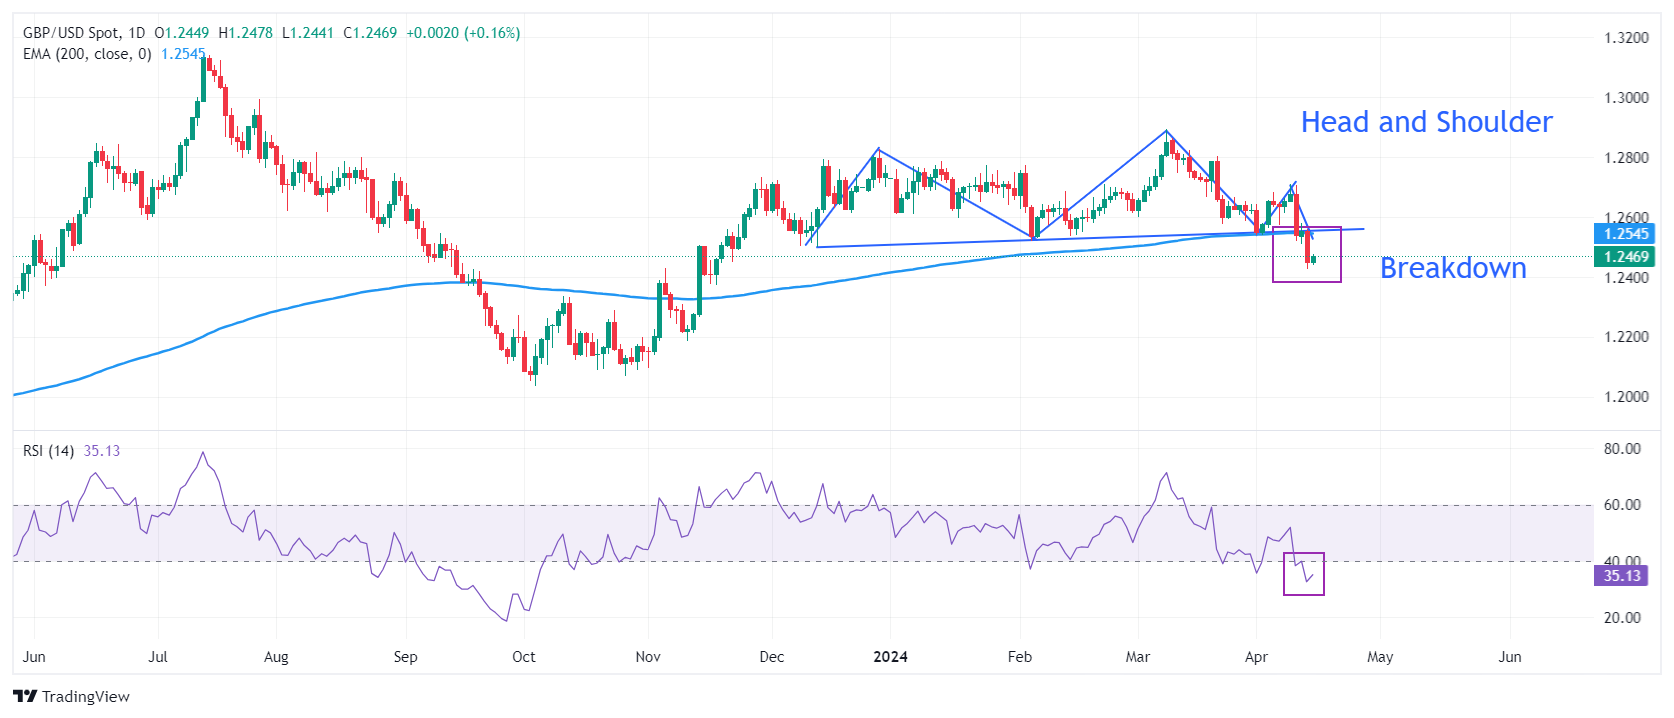
Pound Sterling falls back as upbeat US Retail Sales strengthen US Dollar
-
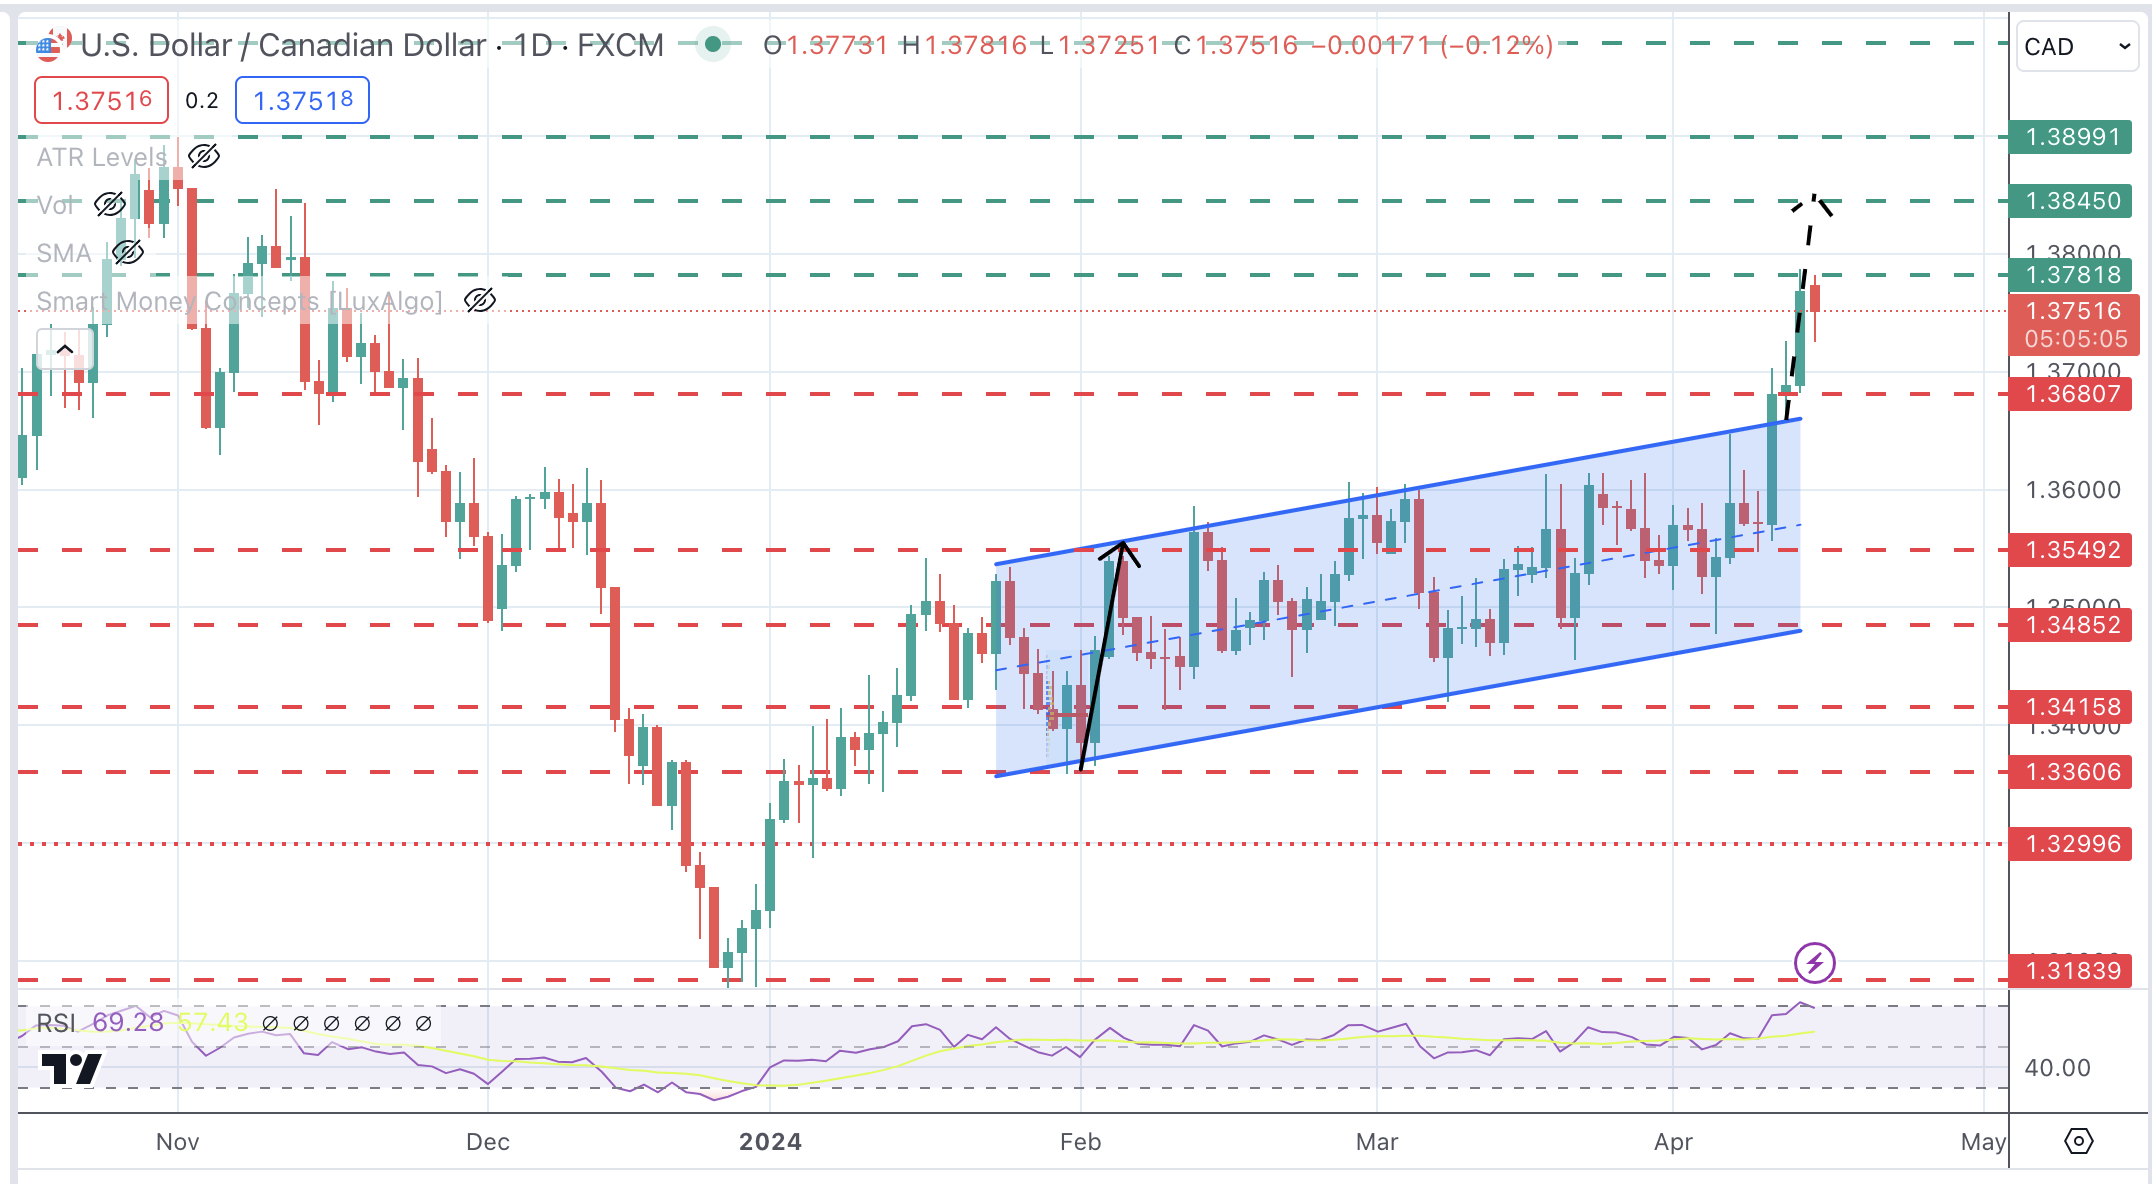
Canadian Dollar remains vulnerable after strong US Retail Sales
-
2024-04-09 – Martin Schlegel: Interest rates and foreign exchange interventions: Achieving price stability in challenging times
Main SNB Background Info

Featured and recent
-
Fake-Mail von der “Sparkasse” #shorts
-
Eilmeldung: Ermittlungen gegen von der Leyen AUSGESETZT!
-
 BMW vs Mercedes Benz #marketcap
 -
Faeser eskaliert komplett!
-
 Unser Kapitaltag in Hannover (Max Otte, Helmut Reinhardt & Florian Günther)
 -
 Was taugen Smartsteuer, Taxfix, WISO & co.? Beste Steuer-Apps & Programme! | Steuererklärung 2023
 -
 Achtung: Extra-Gebühr bei Lieferando
 -
Reading, Teaching, and Quoting Mises
-
Wärmepumpen Markt bricht zusammen!
-
Human Action: Foundations for the Modern Austrian School