Marc Chandler
My articles My offerMy siteAbout meMy videosMy books
Follow on:LinkedINTwitterSeeking AlphaAmazon
George Dorgan
My articles My siteAbout meMy videosMy books
Follow on:LinkedINTwitterSeeking Alpha
CFA SocietyEconomicBlogs
Summary:
Median household income was higher in 2015 than in 2008, but still below 1999 peak in real terms.
The bottom fifth of households by income have just recouped what was lost.
Income growth did best under (Bill) Clinton and Reagan, including for top 5%.
Origin of strong dollar policy means it will not be used as a trade weapon and it hasn’t since Bentsen.
| The dollar-value of all the goods and services the US produces has never been larger. There are two other metrics that capture the recovery. These two Great Graphics come from the Wall Street Journal and draw from Census Bureau figures.
The first shows the change in the median income under US Presidents going back to Nixon. Last year, the median household income, adjusted for inflation, stood at $56.5k. This is $1100 (or 2.1%) above the 2008 level. The peak was reached in 1999 at $57.9k (in 2015 dollars). Clinton and Reagan stand out, and when this year is counted, median household income under the eight years the Obama Administration will likely approach the performance under Nixon. |
Median Income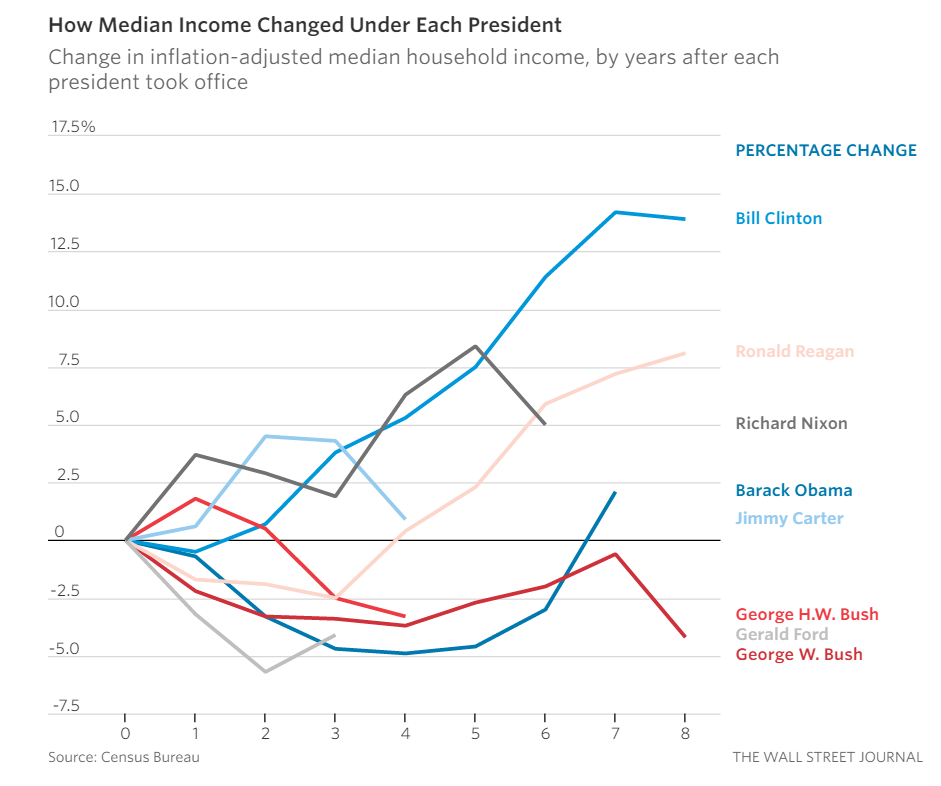 Median Income - click to enlarge. - Click to enlarge |
| The second chart shows what has happened to the income of the bottom fifth of US households since Nixon. Similar with median household income, the poorest 20% of Americans did best under Clinton followed by Reagan. In 2015, the inflation-adjusted income of this group was back to the level it was at before the Great Recession.
The overall poverty rate in the US, according to the Census Bureau was 13.5% in 2015. This is up from the 2008 level of 13.2%. The poverty-level peaked in 2010 at 15.1% . A rising tide may lift all boats, but the yachts the top 5% of households tend to be lifted the most. The top 5% did well under Clinton (21.9%), Reagan (18.8%), and Nixon (11.9%). They have not done poorly under Obama. They have seen their real income grow 8.2% from 2008 through last year. The 95th percentile did not see income gains under the two Bushes and the Ford Administration. For different reasons, the US dollar rallied under Reagan and Clinton. The Reagan dollar rally may have been a function of the policy mix. Contrary to revisionist claims, fiscal policy was expansionary under Reagan and monetary policy was tight under Volcker. This policy mix is the best mix for a currency (and may be the mix of under the next Administration). The Reagan dollar rally ended with coordinated G7 intervention in 1985. After nearly a decade long bear market, the (Bill)n Clinton dollar rally began in 1995. It was proceeded by a tighter monetary policy (1994 Fed rates hikes). It also was aided by the departure of Bentsen from the Treasury Department, who had used the dollar as a weapon in trade disputes with Japan. Rubin placed Bentsen and promised that the US would not use the dollar as a weapon as Baker and Bentsen had done. This is the context, origin and meaning of the strong dollar policy. The Clinton dollar rally was fueled by the US technology advances (internet) and what was later the tech bubble. The Clinton dollar rally, like the Reagan dollar rally, ended with the help of coordinated intervention. This was in October 2000 and done at the request of Europe, which had fallen nearly 30% from its launch level. |
Poorest Fared Under Each President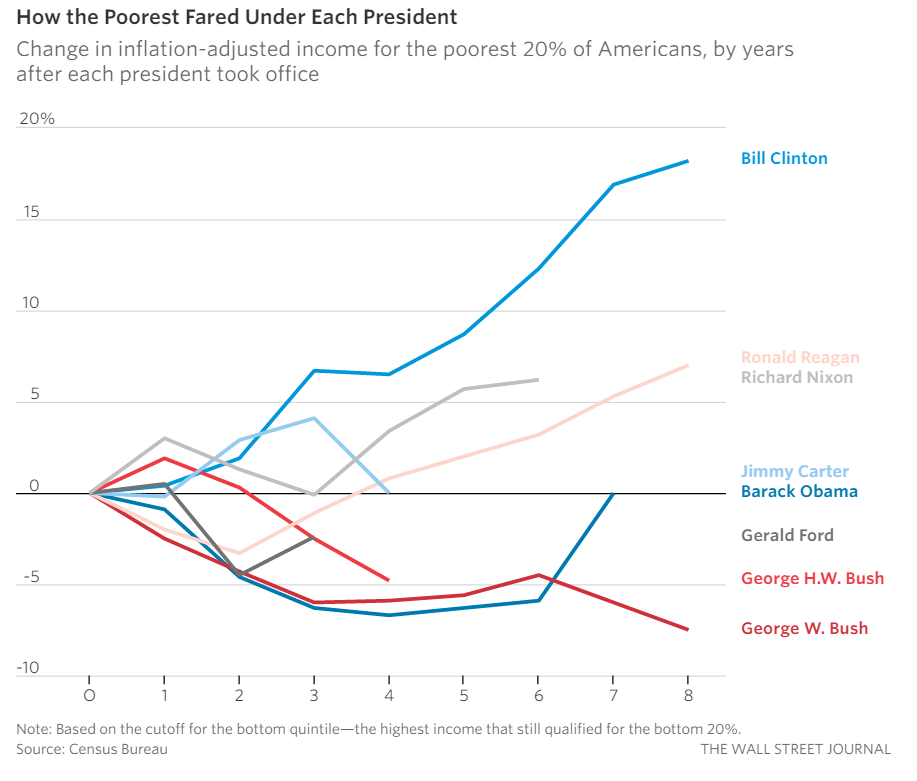 Poorest Fared Under Each President - click to enlarge. - Click to enlarge |
Full story here Are you the author?
Tags: #USD,Great Graphic,newslettersent,US