Category Archive: 5.) The United States
Bi-Weekly Economic Review
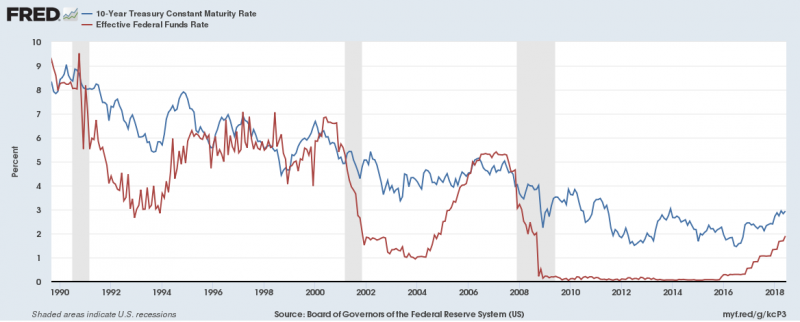
Is the rate hiking cycle almost done? Not the question on everyone’s minds right now so a good time to ask it, I think. A couple of items caught my attention recently that made me at least think about the possibility.
There has been for some time now a large short position held by speculators in the futures market for Treasuries.
Read More »
Read More »
Global Asset Allocation Update
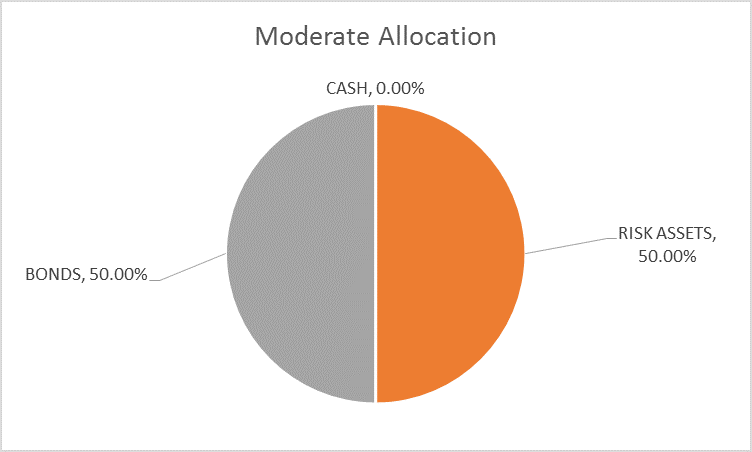
The risk budget is unchanged this month. For the moderate risk investor the allocation to bonds and risk assets is evenly split. There are changes this month within the asset classes. How far are we from the end of this cycle? When will the next recession arrive and more importantly when will stocks and other markets start to anticipate a slowdown?
Read More »
Read More »
There Isn’t Supposed To Be The Two Directions of IP
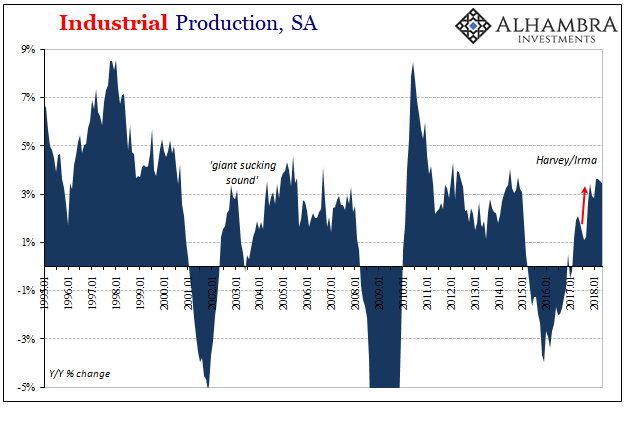
US Industrial Production dipped in May 2018. It was the first monthly drop since January. Year-over-year, IP was up just 3.5% from May 2017, down from 3.6% in each of prior three months. The reason for the soft spot was that American industry is being pulled in different directions by the two most important sectors: crude oil and autos.
Read More »
Read More »
Here We Go Again: Our Double-Bubble Economy
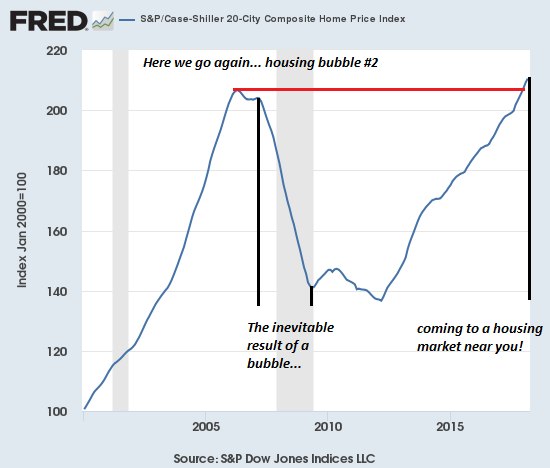
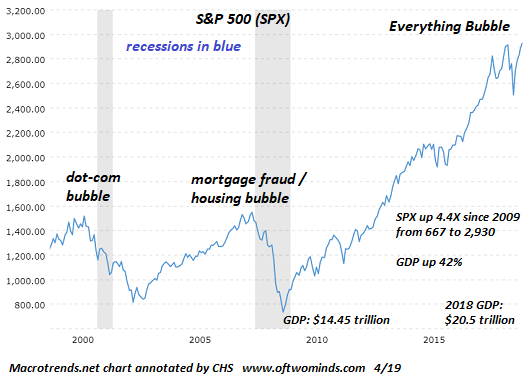
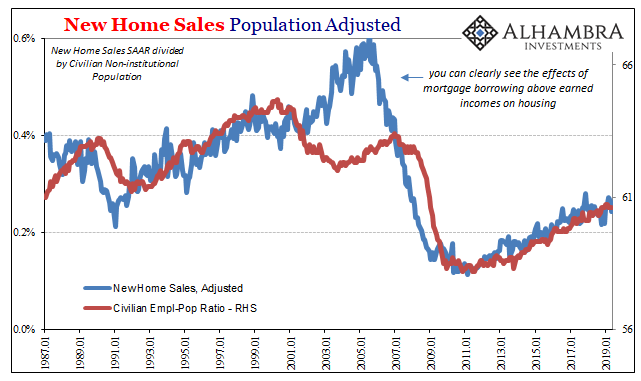
The bubbles in assets are supported by the invisible bubble in greed, euphoria and credulity. Well, folks, here we go again: we have a double-bubble economy in housing and stocks, and a third difficult-to-chart bubble in greed, euphoria and credulity.
Read More »
Read More »
Recent Concerning Consumer Credit Trends Carry On Into April
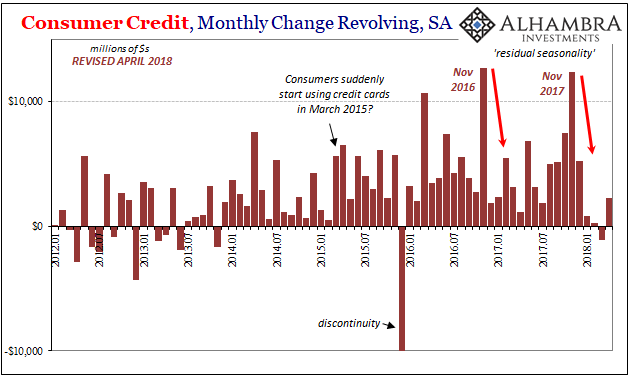
US consumers continue to recover from their debt splurge at the end of last year. Combined with still weaker income growth, the Federal Reserve estimates that aggregate revolving credit balances grew only marginally for the fourth straight month in April 2018. To put it in perspective, the total for revolving credit (seasonally adjusted) is up a mere $2.2 billion for all four months of this year combined, compared to +$5.2 billion in December 2017...
Read More »
Read More »
A Slight Hint Of A 2011 Feel
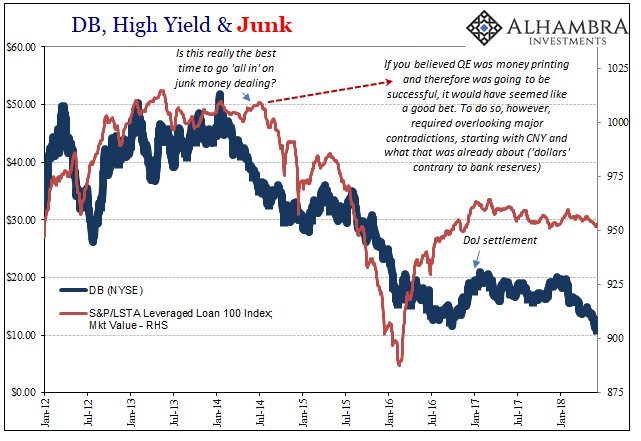
Whenever a big bank is rumored to be in unexpected merger talks, that’s always a good sign, right? The name Deutsche Bank keeps popping up as it has for several years now, this is merely representative of what’s wrong inside of a global system that can’t ever get fixed. In this one case, we have a couple of perpetuated conventional myths colliding into what is still potentially grave misfortune.
Read More »
Read More »
The Three Crises That Will Synchronize a Global Meltdown by 2025
We're going to get a synchronized global dynamic, but it won't be "growth" and stability, it will be DeGrowth and instability. To understand the synchronized global meltdown that is on tap for the 2021-2025 period, we must first stipulate the relationship of "money" to energy:"money" is nothing more than a claim on future energy. If there's no energy available to fuel the global economy, "money" will have little value.
Read More »
Read More »
US Trade Settles Down Again
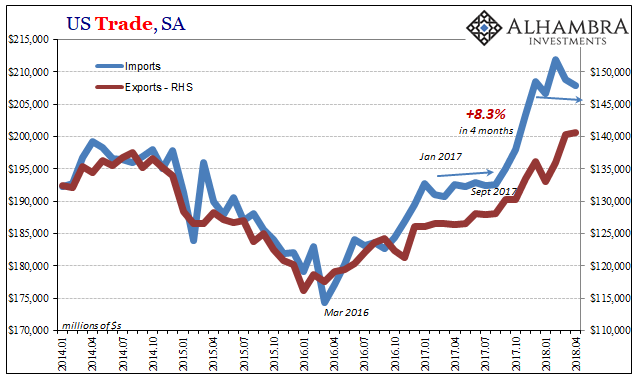
US trade is further leveling off after several months of artificial intrusions. On the import side, in particular, first was a very large and obvious boost following last year’s big hurricanes along the Gulf Coast. Starting in September 2017, for four months the value of imported goods jumped by an enormous 8.3% (revised, seasonally-adjusted). Most of the bump related to consumer and capital goods.
Read More »
Read More »
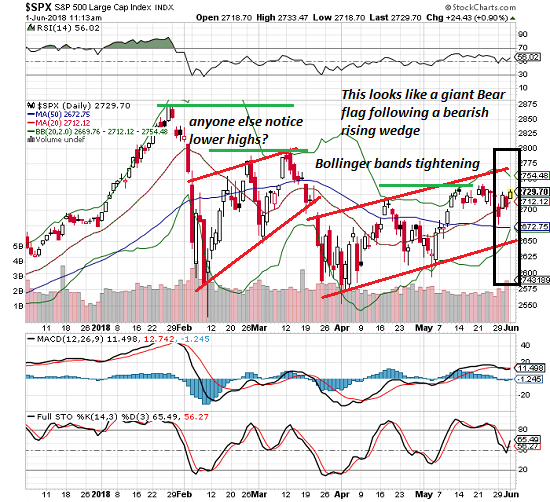
Does Anyone Else See a Giant Bear Flag in the S&P 500?
We all know the game is rigged, but strange things occasionally upset the "easy money bet." "Reality" is in the eye of the beholder, especially when it comes to technical analysis and economic tea leaves.
Read More »
Read More »
Bi-Weekly Economic Review: As Good As It Gets?
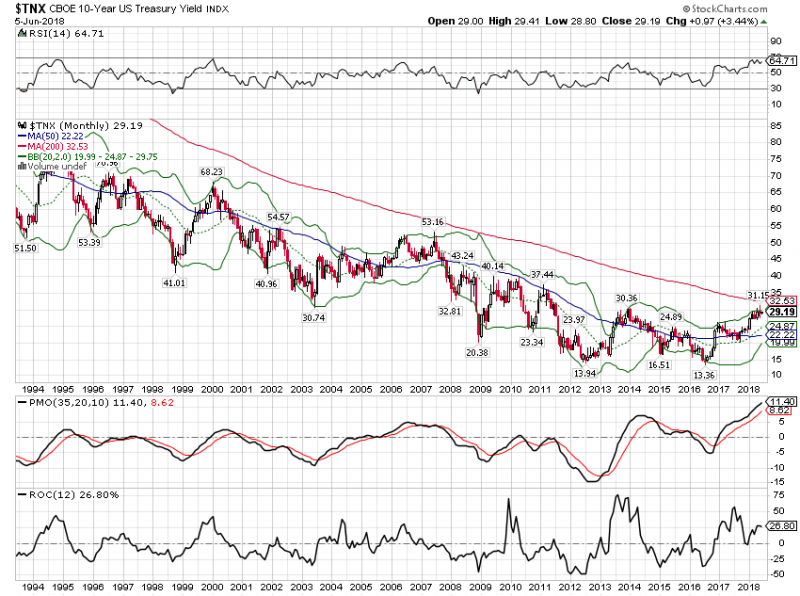
In the last update I wondered if growth expectations – and growth – were breaking out to the upside. 10 year Treasury yields were well over the 3% threshold that seemed so ominous and TIPS yields were nearing 1%, a level not seen since early 2011. It looked like we might finally move to a new higher level of growth. Or maybe not.
Read More »
Read More »
Burrito Index Update: Burrito Cost Triples, Official Inflation Up 43 percent from 2001
Welcome to debt-serfdom, the only possible output of the soaring cost of living. Long-time readers may recall the Burrito Index, my real-world measure of inflation. The Burrito Index: Consumer Prices Have Soared 160% Since 2001 (August 1, 2016). The Burrito Index tracks the cost of a regular burrito since 2001. Since we keep detailed records of expenses (a necessity if you’re a self-employed free-lance writer), I can track the cost of a regular...
Read More »
Read More »
America 2018: Dicier by the Day
Scrape all this putrid excrescence off and we're left with a non-fantasy reality: everything is getting dicier by the day. If we look beneath the cheery chatter of the financial media and the tiresomely repetitive Russian collusion narrative (that's unraveling as the Ministry of Propaganda's machinations are exposed), we find that America in 2018 is dicier by the day.
Read More »
Read More »
How Systems Collapse
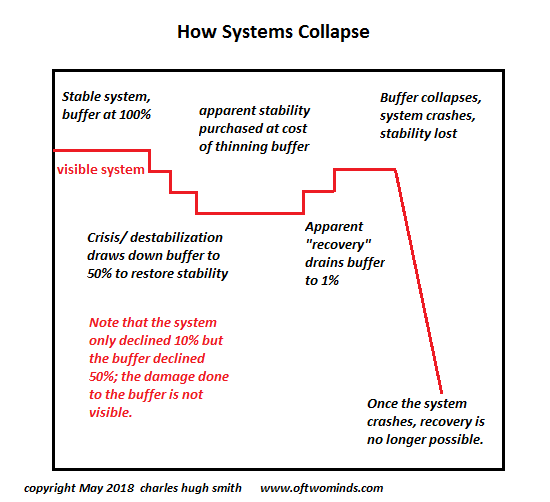
This is how systems collapse: faith in the visible surface of abundance reigns supreme, and the fragility of the buffers goes unnoticed. I often discuss systems and systemic collapse, and I've drawn up a little diagram to illustrate a key dynamic in systemic collapse. The key concepts here are stability and buffers. Though complex systems are never static, but they can be stable: that is, they ebb and flow within relatively stable boundaries...
Read More »
Read More »
The Currency of PMI’s
Markit Economics released the flash results from several of its key surveys. Included is manufacturing in Japan (lower), as well as composites (manufacturing plus services) for the United States and Europe. Within the EU, Markit offers details for France and Germany.
Read More »
Read More »
Globally Synchronized Asynchronous Growth
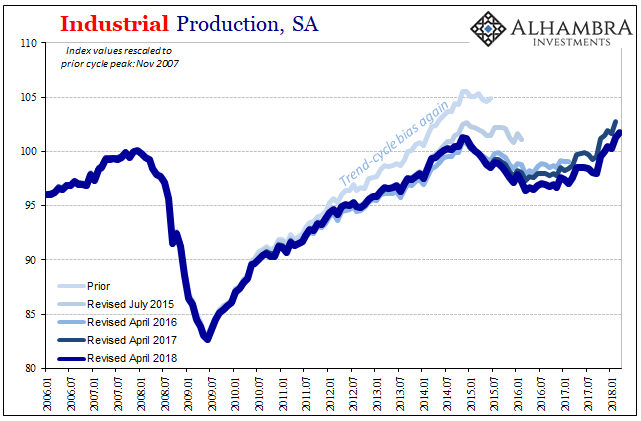
Industrial Production in the United States rose 3.5% year-over-year in April 2018, down slightly from a revised 3.7% rise in March. Since accelerating to 3.4% growth back in November 2017, US industry has failed to experience much beyond that clear hurricane-related boost. IP for prior months, particularly February and March 2018, were revised significantly lower.
Read More »
Read More »
Tax Cuts And (Less) Spending
After being rumored and talked about for over a year, at the end of last year the tax cuts were finally delivered. The idea had captured much market attention during that often anxious period of political flirtation. Prices would rise or fall by turn based on whether or not it seemed a realistic possibility.
Read More »
Read More »
Watching Imports
The US trade deficit, a sensitive political topic these days, declined sharply in March. It had expanded significantly (more deficit) in January and February, reaching nearly -$76 billion (seasonally adjusted) in the latter month, before posting -$68 billion in the latest figures. Exports rose while imports fell in March, making for the largest single month change in the trade condition in many years.
Read More »
Read More »
Why The Last One Still Matters (IP Revisions)
Beginning with its very first issue in May 1915, the Federal Reserve’s Bulletin was the place to find a growing body of statistics on US economic performance. Four years later, monthly data was being put together on the physical volumes of trade. From these, in 1922, the precursor to what we know today as Industrial Production was formed. The index and its components have changed considerably over its near century of operative history.
Read More »
Read More »


