


Joseph Y. Calhoun
My articles My siteAbout meMy videosMy books
Follow on:LinkedINTwitterSeeking AlphaAmazon
It’s been a slow turnin’
From the inside out
A slow turnin’
But you come about
Slow learnin’
But you learn to sway
A slow turnin’ baby
Not fade away
Now I’m in my car
I got the radio on
I’m yellin’ at the kids in the back
‘Cause they’re bangin’ like Charlie Watts
Slow Turning by John Hiatt
“How did you go bankrupt?” Bill asked.
“Two ways”, Mike said. “Gradually and then suddenly.”
The Sun Also Rises, By Ernest Hemingway
I first wrote about the current economic slowdown a year ago and Jeff Snider actually started seeing signs of slowdown in the Eurodollar market as early as May 2018. So, the slowdown we’re in now certainly isn’t a surprise here at Alhambra. I think though that we often forget how long these things take to develop. When we look back at past recessions it seems as if things happened quickly but reading about a recession, or more accurately the onset of recession, is a lot different than living through it. Like Mike’s bankruptcy in Hemingway’s masterpiece, recession comes on gradually…and then suddenly.
The most widely known – now – indicator of recession is the inversion of the yield curve, when short term interest rates rise above long term rates. There are many versions of “the” yield curve but I have always used the 10 year and 2 year Treasury notes. It has inverted prior to every recession in recent memory and because of its accuracy is now widely followed. But as I’ve pointed out many times in these notes, it isn’t the inversion that signals recession but rather the rapid steepening that occurs as short term rates fall rapidly in anticipation of Fed rate cuts. Inversions do come before recession but sometimes it is way before recession.
In the cycle that preceded the millennial recession that started in March of 2001, the yield curve (10/2 curve) first inverted in June of 1998 although it only lasted less than a month. The final inversion started in February of 2000, a full year before the onset of recession. In the last business cycle the curve initially inverted in February of 2006, 22 months before the start of the recession. It turned positive and then inverted again in June and August of ’06. It turned positive again in March of ’07 and inverted the final time in May of ’07, still seven months before the onset of recession. Obviously, that’s a lot of lead time before recession and one should note that often some of the biggest gains in a bull markets happen at the end. So, bailing when the curve first inverts is far from an ideal strategy. This is the “gradually” part of the onset of recession.
The “suddenly” part of the onset of recession is the steepening that happens after the inversion. In the 2001 recession the curve steepened 125 basis points over 11 months from its nadir. And once it turned positive again – long term rates higher than short term – it was only three months before recession hit. In the 2008 version, it took a bit longer. From maximum inversion to recession took six months. That’s not too early and not too late because history says you actually have some time even after recession starts to adjust your portfolio. If you can hit a window that stretches from six months before to six months after the onset of recession you are going to be way ahead of the crowd. Act too soon and miss too much upside, act too late and get killed when the bear hits.
So, where are we today, assuming this indicator will prove as accurate as it has in the past? Hmmm. Well, the 10/2 curve has not inverted yet in this cycle so we don’t have any kind of signal yet from our preferred yield curve. Of course, it might not invert prior to recession this time. I’ve been wondering about that this entire cycle. Have we changed the nature of this indicator by publicizing it and spreading knowledge of it via modern communication methods? Have we created a kind of economic Heisenberg effect by writing about the inversion of the yield curve? I guess what I’m saying and really trying not to is this: is it different this time?
Well, sure it could be. Maybe this curve won’t invert this cycle and we should just be watching instead for the bull steepening that comes right before recession, the “suddenly” part. Unfortunately – or fortunately – that doesn’t provide any kind of definitive signal. The curve has only steepened about 15 basis points from its flattest point in December. But that could have been the nadir of the curve and we could be about to enter the rapid steepening that has, in the past, preceded recession. But in the last three recessions the maximum inversion of the curve came at least a year in advance of the onset of recession so even if that is the case, recession wouldn’t be on the schedule until the end of this year.
We could also look at other yield curves that have inverted. The 10 year/3 month spread turned negative in May of this year and it has also inverted prior to the last few recessions so maybe we’re closer than the 10/2 indicates? But that doesn’t really help much. If the last two recessions are any guide we are somewhere between 9 months and 2 years from recession. Not all that helpful.
| So, is any of this obsession with yield curves useful? By itself, the answer is pretty obviously no. What you really need are multiple signals, confirming indications across markets. Take a look at credit spreads (the spread between junk bond yields and Treasuries) in conjunction with the yield curve.
Put in context, what is going on right now with the yield curve and credit spreads could be the gradual part of the onset of recession. Or this could be like 1994 when the curve hit 15 basis points and recession didn’t hit for another 7 years. I don’t think so, by the way, but it is within the realm of possibilities. I suspect we are nearing the end of this cycle but how and why it ends is anyone’s guess at this point. The economy, as I’ll discuss below, is slowing but that’s all we know right now and that was fully expected. The US economy is a $20 trillion behemoth and it doesn’t turn on a dime. As John Hiatt put it, it’s a slow turnin’ and no matter how many times the kids in the back ask, we aren’t there yet. |
US High Yield Master 2000-2015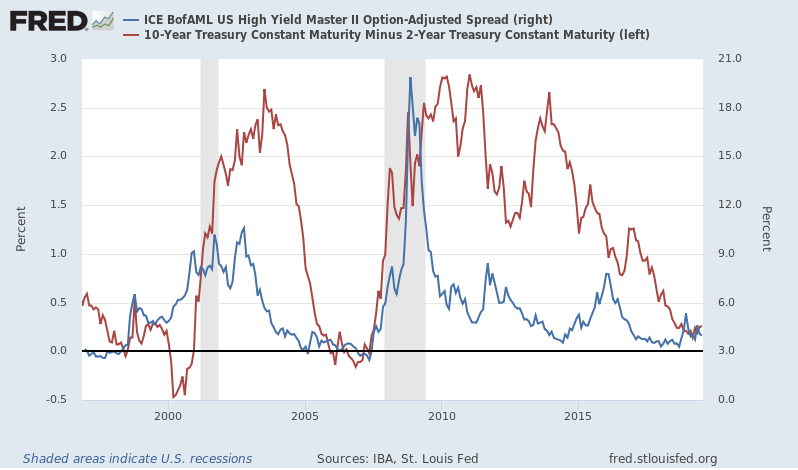 - Click to enlarge |
Economic ReportsEconomic Growth & InvestmentThe reports in this group generally showed stabilization after slowing. The CFNAI, our favorite broad indicator, rebounded a little and the 3 month moving average moved up from -0.37 to -0.17. A reading of zero would be growth on trend so we’re just a little below that. |
Economic Growth & Investment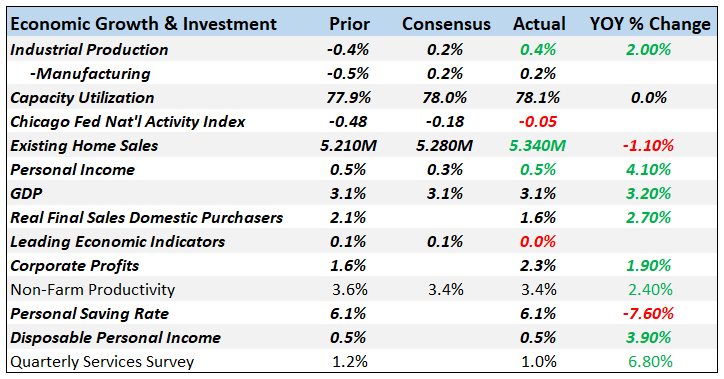 . |
ProductionThe sentiment type surveys were a little weak but the only one that is really concerning is the Chicago PMI which also happens to be the most volatile of the bunch. |
Production - Click to enlarge |
Consumption & DistributionNothing alarming here as consumption has been growing at a fairly weak pace this entire cycle. Wholesale sales up just 0.1% is a bit concerning because inventories are growing faster than that. |
Consumption & Distribution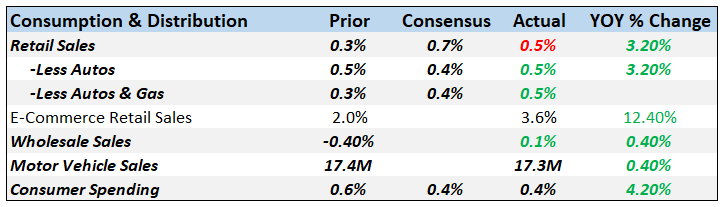 - Click to enlarge |
InventoriesInventories are going to add to GDP in the quarter just as they did last quarter but that isn’t a good thing. Inventory/sales ratios are quite elevated and at some point either sales have to pick up or companies will cut back on production and work down inventories. One wild card here is the trade war as we don’t know how much of this inventory build was intentional as a way to avoid future tariff hikes. A trade deal with China – which I am still skeptical will happen soon – might well mean an immediate slowdown as companies work off unwanted inventory. |
Inventories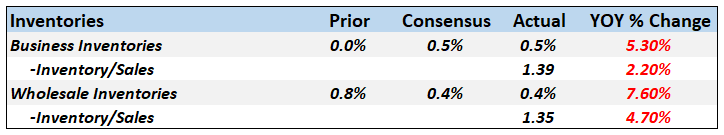 - Click to enlarge |
OrdersManufacturing is mixed despite the headline numbers on these reports. A lot of this is the Boeing effect and ex-transportation orders were positive, if modestly so. Core capital goods orders rebounded but are still barley higher than the reading in 2000. That’s pretty amazing when you think about it. No wonder productivity growth has been punk the entire 21st century. |
Orders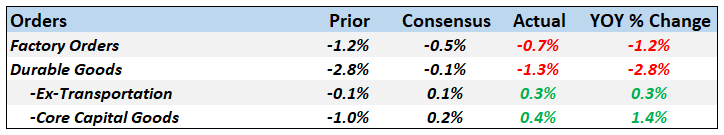 - Click to enlarge |
TradeA rebound in exports and imports doesn’t change the picture here. Trade is struggling as the Trump administration continues to bash enemy and ally alike. And it isn’t working by the way – look at the change in the trade deficit yoy. Bigger budget deficits mean bigger trade deficits. Trump’s budget is shooting his trade policy in the foot. |
Trade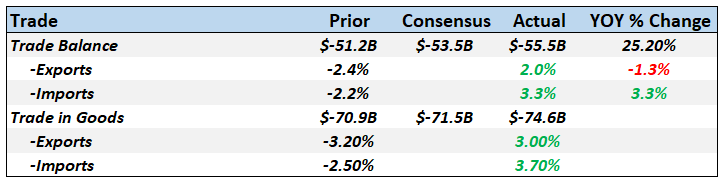 - Click to enlarge |
InflationThere isn’t an inflation problem if you go by any of these measures. |
Inflation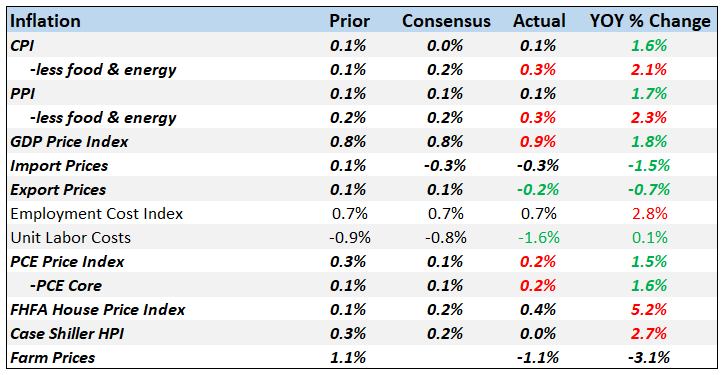 - Click to enlarge |
EmploymentEmployment has been positive but fairly weak this entire expansion and it hasn’t changed. The pace of job growth this year is slowing but it isn’t particularly concerning at this point. |
Employment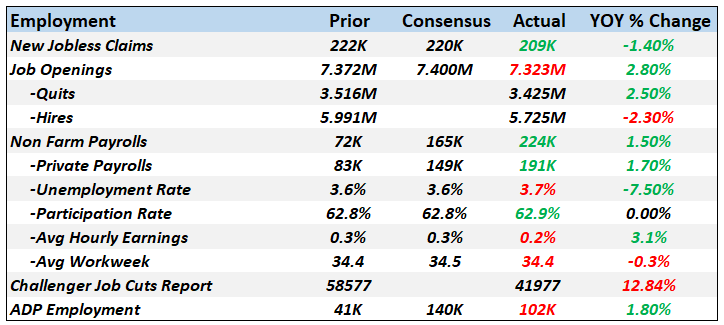 - Click to enlarge |
ConstructionThere’s been a lot of chatter about housing market weakness but so far it just looks like a pause rather than a big dropoff. Residential investment has been a negative for GDP for five quarters in a row but the subtraction is mild. Housing construction is going to have to pick up at some point though because population growth, although slowing, is still positive. |
Construction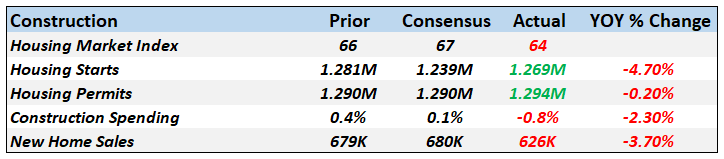 - Click to enlarge |
SentimentConsumer confidence had a big drop but the U of Michigan survey hasn’t confirmed it yet. Small business optimism remains pretty buoyant. |
Other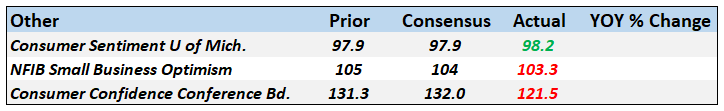 - Click to enlarge |
InternationalGermany and Europe more generally has been quite weak on the manufacturing side. One bright spot is that revisions of prior data have been positive. The trend, however, is still down. Japan has surprised to the upside but some of the household spending may just be accelerated due to the expected consumption tax hike. China appears to be stabilizing but who knows if the data is any good. It could be nothing more than trade war bravado. |
International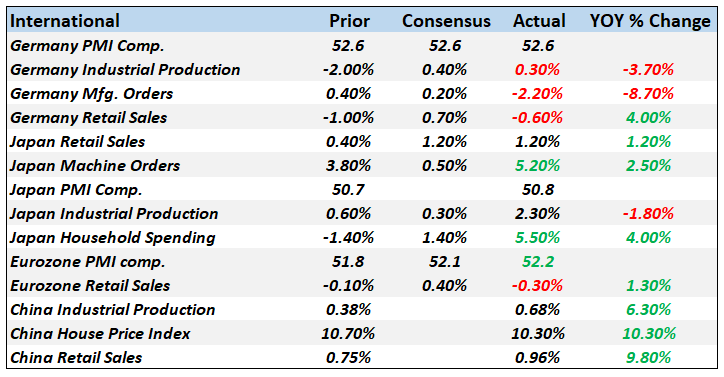 - Click to enlarge |
The global economy has obviously slowed and that includes the US. There is nothing yet in the data or markets that warrants going on full recession alert but the slowdown does make the economy more vulnerable to a shock. What that shock might be or even if one is coming is not something that can be predicted. Even if there is no shock, we could just keep slowing and fall into contraction but that would be betting on a low probability outcome in my opinion. That just isn’t how this process usually works. How do we get into recession? Gradually…and then suddenly.
Tags: Alhambra Research,cfnai,Consumer Confidence,Consumer Sentiment,consumption,credit spreads,economic data,economy,employment,Inventories,Investing,Markets,Monthly Macro Monitor,newsletter,recession,Retail sales,trade deficit,Trade Wars,Yield Curve


