Charles Hugh Smith
My articles My offerMy siteAbout meMy videosMy books
Follow on:TwitterFacebookYoutubeAmazon
|
We all know the game is rigged, but strange things occasionally upset the “easy money bet.”
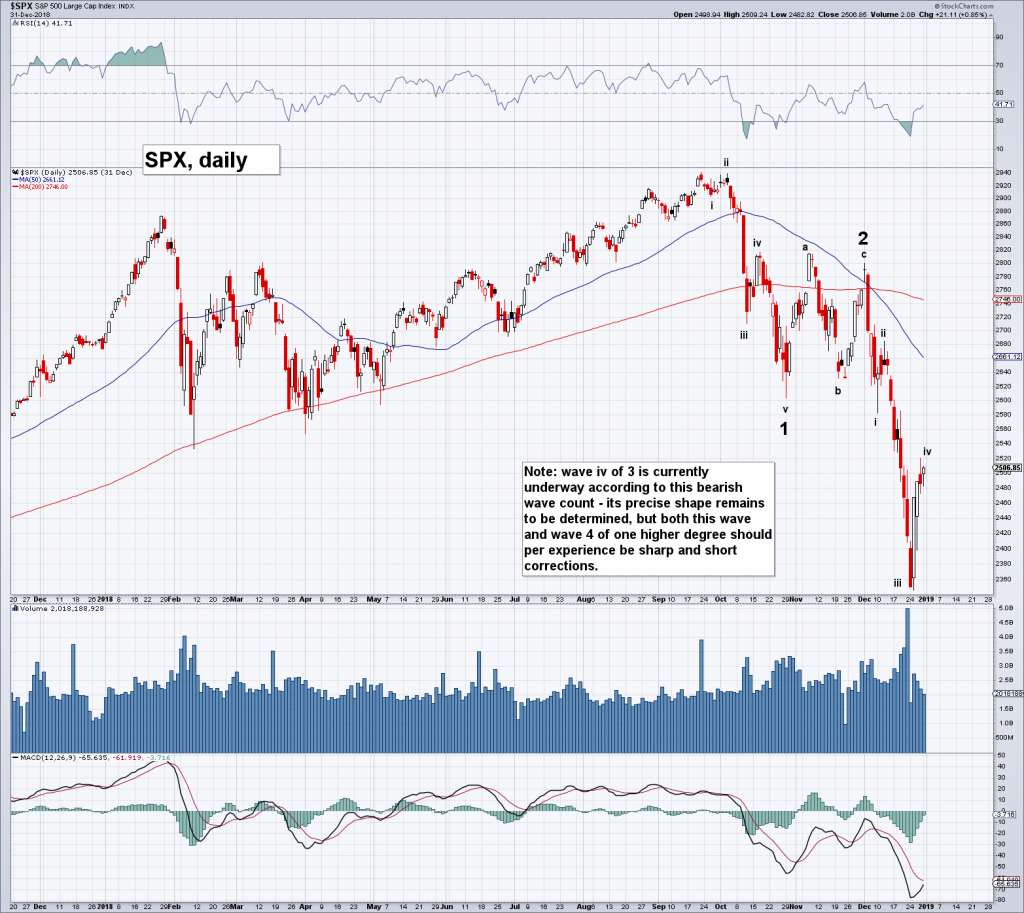
“Reality” is in the eye of the beholder, especially when it comes to technical analysis and economic tea leaves. It seems most stock market soothsayers are seeing a breakout of the downtrend that erupted in early February, and so the path to new all-time highs is clear.
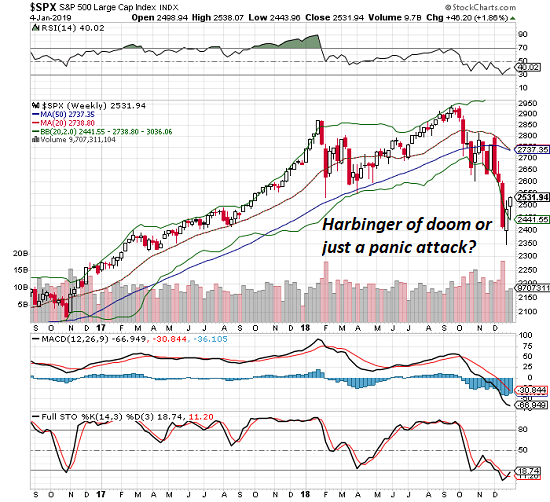
Does anyone else see a giant bear flag pattern in the daily chart of the S&P 500? Maybe I’m the only one who sees a bearish signal instead of a bullish breakout.
What I see post-mini-crash is a bearish rising wedge which broke to the downside as rising wedges are wont to do.
What followed the rising wedge? A bear flag. As the name implies, Bear Flags are, well, bearish; they tend to break lower in a continuation of trend. The consensus of soothsayers seems to be that the trend is still bullish. I guess I’m the only one who sees lower highs since late January, something that doesn’t strike me as evidence of a bullish trend, the definition of which is higher highs.
|
S&P 500 Large Cap Index 2018(see more posts on S&P 500 Large Cap Index, )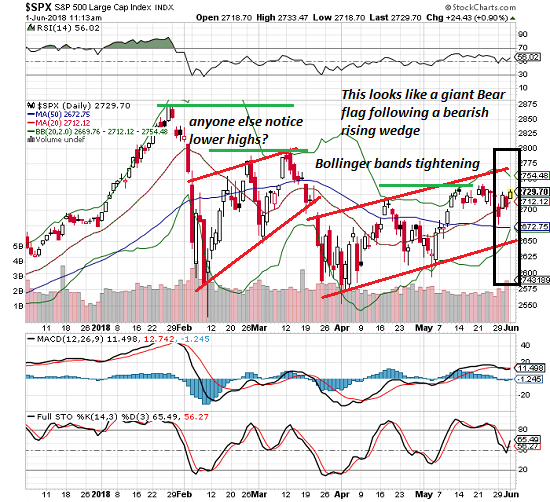 - Click to enlarge |
Having treaded water for the better part of the month, the Bollinger bands are now tightening, a condition that typically presages a major move up or down.
If the consensus is correct and the technical snapshot is 100% bullish (breakout, up-trend, etc.) then the next big move will be to the upside. Plummeting volatility (VIX) suggests the majority of punters are in the 100% bullish-signals camp.
If the tin-foil hat outlier (me) who sees a big fat bear flag is correct, the next big move will “surprise to the downside.”
Meanwhile, a smaller camp of soothsayers expects a trendless chopfest, i.e. a continuation of May’s up and down action within a tight trading range.
The roulette wheel is still spinning, so place your bets. We all know the game is rigged, but strange things occasionally upset the “easy money bet.”

At readers' request, I've prepared a biography. I am not confident this is the right length or has the desired information; the whole project veers uncomfortably close to PR. On the other hand, who wants to read a boring bio? I am reminded of the "Peanuts" comic character Lucy, who once issued this terse biographical summary: "A man was born, he lived, he died." All undoubtedly true, but somewhat lacking in narrative.
Tags: newslettersent,S&P 500 Large Cap Index