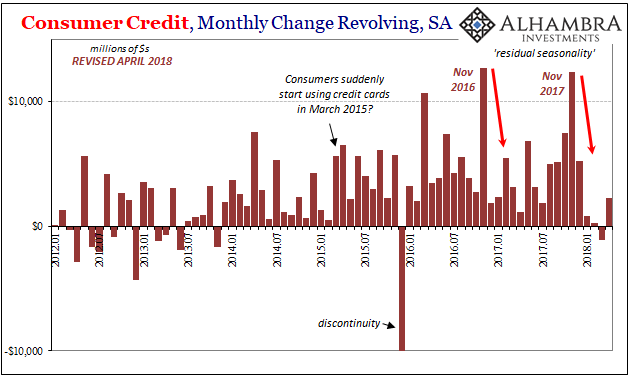
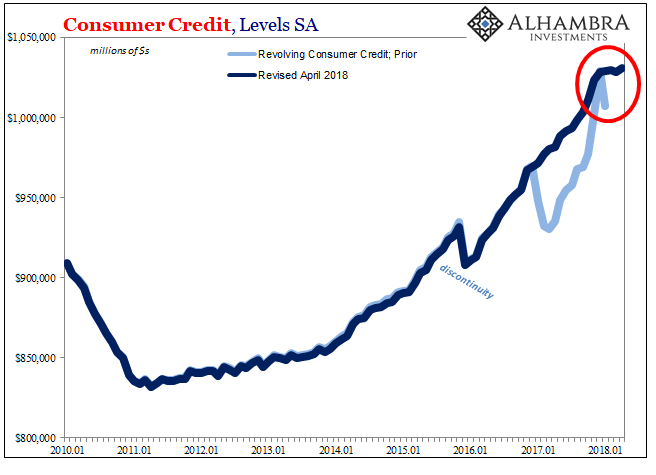
| US consumers continue to recover from their debt splurge at the end of last year. Combined with still weaker income growth, the Federal Reserve estimates that aggregate revolving credit balances grew only marginally for the fourth straight month in April 2018. To put it in perspective, the total for revolving credit (seasonally adjusted) is up a mere $2.2 billion for all four months of this year combined, compared to +$5.2 billion in December 2017 alone, +$12.4 billion in November, and +$7.5 billion in October.
We have to consider that we might be witnessing where all the tax cuts have gone so far. In survey after survey, high proportions of consumers indicated that they would use the boost in their take home pay (a good thing regardless of any macro consequences) provided by lower effective tax rates to pay down existing debt. |
Consumer-Credit Revolving Monthly Change 2012-2018 |
| In combination with “residual seasonality”, meaning weakness in income transferring the Christmas splurge into more caution over the following months, these consumer credit figures suggest why there hasn’t been much of a detectable response despite so much positive rhetoric about the tax changes (meanwhile, on the other side of tax reform corporations are, predictably, spending record amounts on share repurchases). |
Consumer Credit Revolving 2010-2018 |
| As always, these figures are subject to at times substantial revisions. As it stands now, the fact that this seasonal behavior appears to have extended into April and Q2 is not a positive sign for economic acceleration. This would be consistent with updated data for Personal Income and Spending which shows no change in the current flatness in especially income.
The low savings rate thereby proposes a lack of margin for consumer purchasing behavior regardless of their situation in revolving credit. That may be why, according to the latest estimates for consumer credit, Americans are choosing to pay down so much revolving debt either through tax cuts, foregoing spending, or, more likely, some of both. |
Personal Income 2011-2018 |
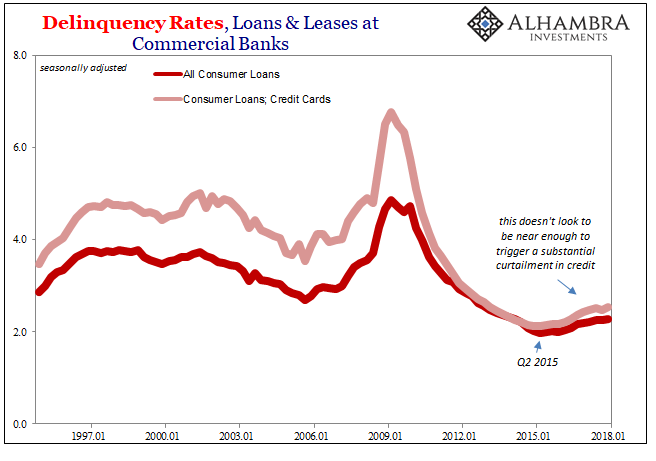
| Delinquencies in consumer credit were very slightly higher in updated Q1 estimates than in revised Q4 numbers. For credit cards, the delinquency rate in the first quarter was 2.28% compared to a revised 2.26% in last year’s last quarter. It really hasn’t moved all the much from the middle of last year, with troubled loans continuing to be near record lows as a proportion of outstanding debt. |
Consumer Credit Delinquency Rates 1997-2018 |
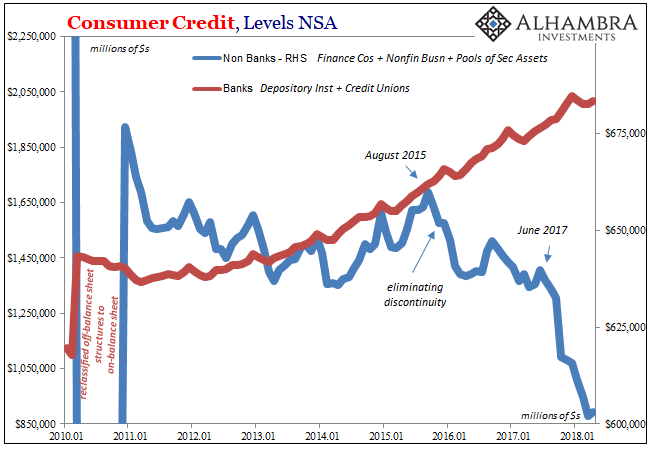
| Still, certain segments of the consumer credit market are actively pulling back from the space. Non-bank participants in particular have been quite emphatic reducing their issuance. Banks, on the other hand, continue to act as they always do regardless of any fundamental prospects for the economy, labor market, or consumer habits (just as they did in the last cycle).
Some of that is almost certainly related to auto loans and leases, especially of the subprime variety. Though it isn’t showing up in overall consumer delinquencies, there are and have been signs that the auto splurge up until the middle of 2015 might be catching up with the downgrade in the labor market around the same time.
|
Consumer Credit 2010-2018 |
| This would suggest that the weakened labor market is having its effect right where you would expect – at the most vulnerable edges of the current stagnating economy.
There isn’t enough detail in the consumer credit figures to make anything more than a reasonable inference as to correlation across labor (meaning income) to auto lending and therefore auto sales. Given the behavior of delinquencies in overall consumer credit, it would seem most likely that subprime autos out of everything might be pushing non-bank issuers to reconsider their lending portfolios. That all might sound like late cycle patterns and behavior, but it’s really not. Instead, it proposes that there is no cycle, at least not one that would appear familiar by comparison to past business cycles. Instead, it is this recurring, partially reductive conduct that over time acts like a tightening noose or ratchet effect; it’s not recession that’s indicated, rather another ratchet tighter against the whole economy (the post “rising dollar” L). |
Real GDP Trends 2011-2018 |
| The result consistently is a lower ceiling for each of these limited upswings as one element of the prior advance, in this case autos and to some degree consumer spending discretion overall, falls into the same low-grade trend as the rest of the economy. Over time, the number among the few industries or capacities where things are going well keeps diminishing.
The recent estimates for consumer credit really put more emphasis on what might be the true state of US labor and the labor curves at the margins. None of this is at all like what should be going on where a 3.8% unemployment rate is valid. Instead, it is more corroboration of an economy that can’t seem to grow much at all, which is why so much American labor remains on the sidelines (slack). It’s not a labor shortage, it’s a very clear work shortage. |
Labor Curves 2018 |
Tags: Auto Sales,Consumer Credit,currencies,economy,Federal Reserve/Monetary Policy,income,Labor Market,Markets,newslettersent,real personal income excluding transfer receipts,revolving credit


