| The good news is that the economy just printed its second consecutive quarter of 3% growth, a feat not accomplished since Q2 and Q3 2014. The bad news is that the growth spurt in 2014 was better, quantitatively and qualitatively. Those two quarters produced gains of 4.6% and 5.2% (annualized) in GDP, much better than the most recent 3.1% and 3% prints of Q2 and Q3 2017. And it took a hurricane to get the most recent quarter up to the 3% level, an event, as a South Florida resident, I surely hope isn’t repeated any time soon. Further bad news can be found in the period immediately after that 2014 spurt as quarterly growth fell to 0.5% by Q4 2015; the spurt was just that and did not produce a sustainable change in the overall trajectory of the economy. I see no reason to expect this episode to end any differently.
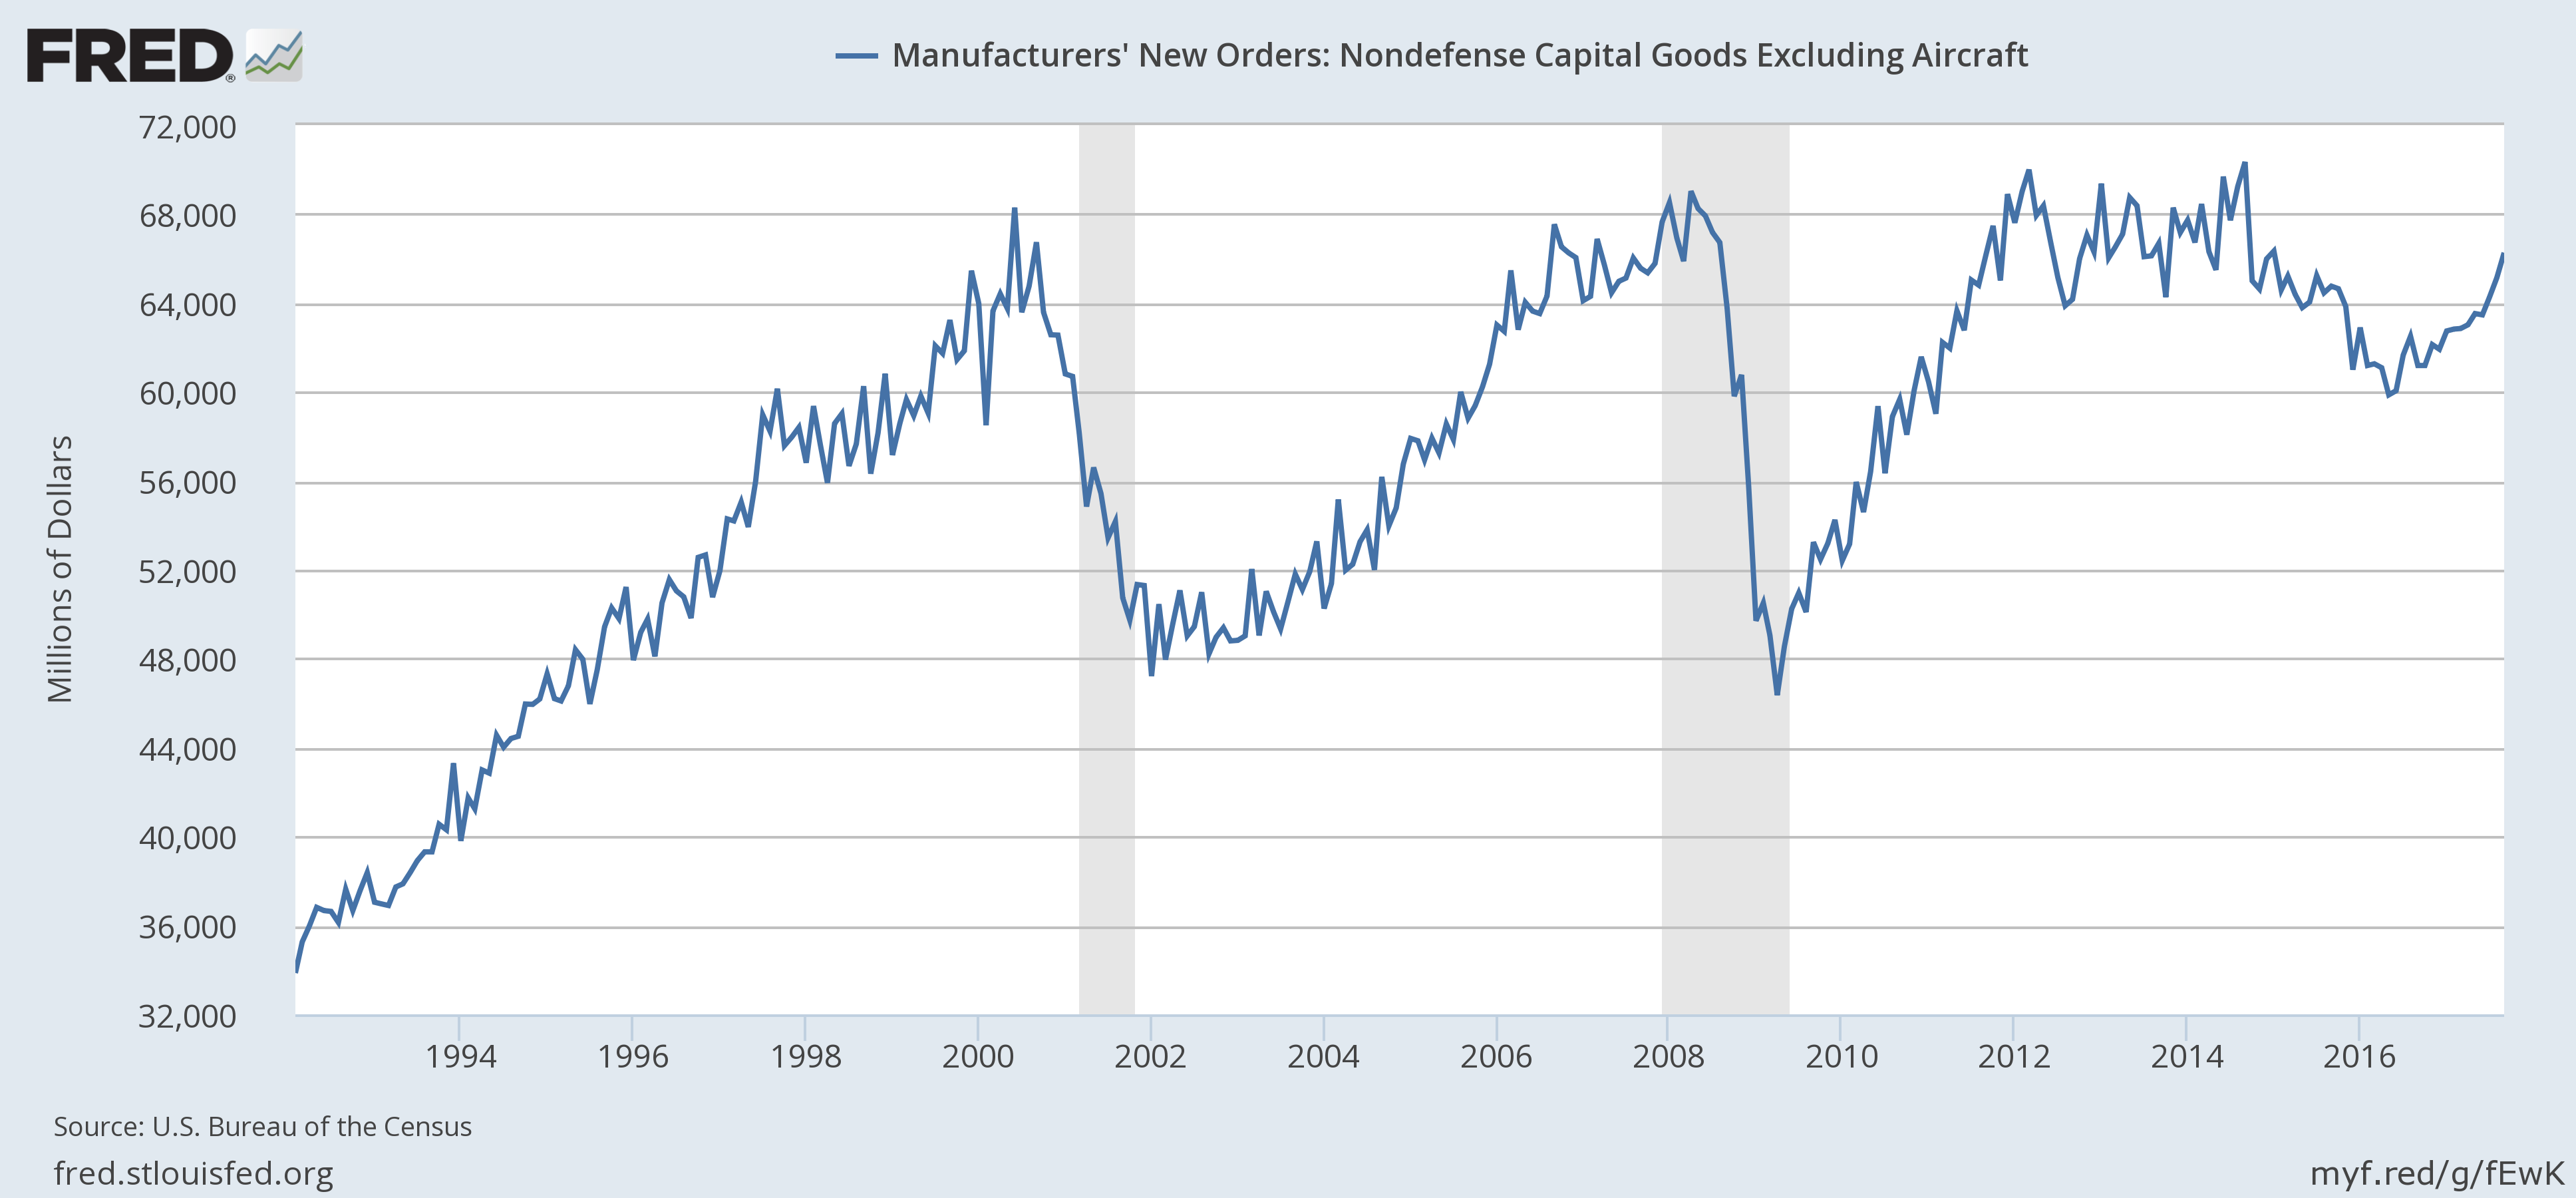
It probably can’t be emphasized enough to investors that the quarter to quarter or month to month changes we see in the economic data are so much noise and tell us very little. Through the course of a business cycle we can have several slowdowns and accelerations that turn out to be nothing more than that, short term changes in the first or second derivative. That’s why we so often look at year over year data and even longer periods to get a sense of what is really going on. The most recent durable goods orders report is a great example (and these ups and downs are much more pronounced in the goods side of the economy). Durable goods orders were reported to be up 2.2% month over month and 8.3% year over year (both figures seasonally adjusted). In isolation those sound like solid growth rates and reason for celebration – the economy is finally breaking out of the new normal! – until you zoom out and realize that the level of orders is about the same as November of 2013, a full 4 years ago. And by the way, not significantly different than July of 2007 and only about 20% higher than the beginning of the fourth quarter…..of 2000, seventeen years ago. Now, it may well be that this is the beginning of a more sustained uptrend but you certainly can’t make that claim from the data we have today. There are plenty of other metrics that show a similar trajectory. Core capital goods orders – a slice of the durable goods report – are no higher today than late 2000. Exports and imports are both up 4.6% and 6.1% year over year and yet less than March of 2014. Housing starts are up 6.1% year over year but less than November of 2013. New home sales are in an uptrend since the low in 2011 but are only now back to the levels that prevailed in late 2007 just before the last recession. Construction spending is also in an uptrend since 2011 but only recently surpassed the previous cycle peak in 2006. |
US Manufacturers' New Orders, 1994 - 2016 |
| As I said above, it may be that these recent uptrends are finally the ones we’ve been waiting for this entire cycle, the beginning of a sustained level of growth more like what we’ve experienced in previous cycles. But if that is true, much of the capital markets aren’t buying it. Our indicators point to, at best, a continuation of the 2% growth path we’ve been on for the last 4 years. Stocks are the outlier, anticipating a future other markets don’t see. I don’t know if that is a function of hyped expectations for Trump administration economic reforms or just the same old TINA (there is no alternative…to stocks) but in either case I question how much longer it can last.
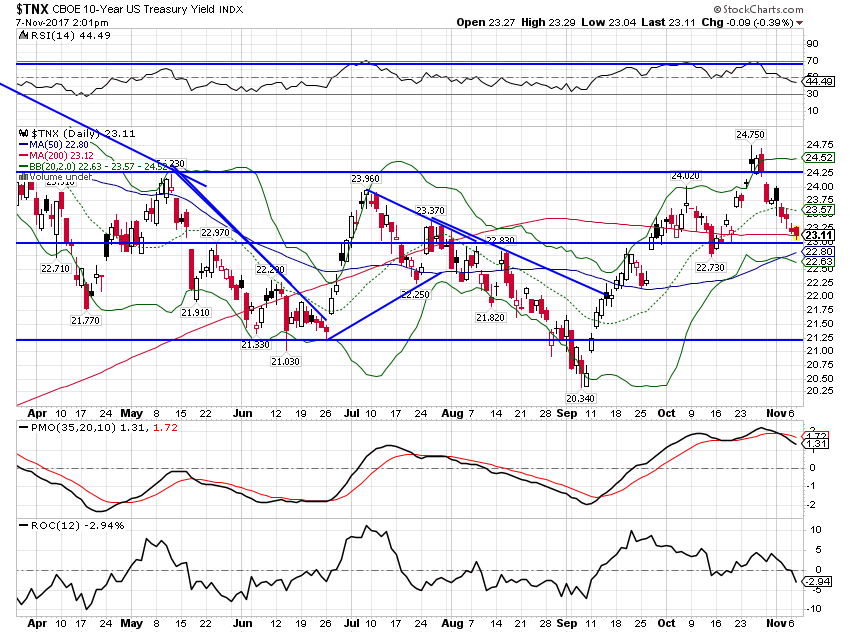
As an old timer, I’ve been around long enough to know that interest rates are not, as most people seem to believe today, the driver of stock valuations. Investing in stocks is a lot harder than merely comparing the yield on a Treasury to the dividend yield of the S&P 500 and buying the one paying you more. But one must also take into account the desire, the need, of savers – especially retirees – to maintain a level of income they believe they need. Desperate people do desperate things, like believe that stocks can be bond substitutes. So, yes, interest rates do have an impact on stock prices. What TINA believers may not have noticed is that interest rates on the short end of the curve, where savers tend to congregate, are creeping higher as the dividend yield of the S&P 500 drifts lower. At 1.85% the dividend yield on the S&P 500 has been less than the 10 year Treasury for quite some time now. With the 2 year Treasury yield now around 1.625%, it seems ridiculous to think that anyone is buying SPY for the yield pickup. But you don’t get a lot more if you shift over to the S&P “high” dividend ETF, a mere 4% yield and 5% earnings growth for which an investor must pay a less than reasonable 20 times earnings. We were doing some research earlier this week on a company whose bonds we were considering. This is a blue chip company that everyone knows or at least thinks they do. See if you can identify this company: Current dividend yield: 3.2%, Payout ratio: 140% Trailing P/E: 44 Price/Book: 9 Price/Sales: 5 Since 2011: Revenue has declined from $46.5 billion to $37.31 billion TTM. Operating income has fallen from $10.2 billion to $7.5 billion. EPS has dropped from $1.85 to $1.04 TTM. Free cash flow is unchanged. ROA has dropped from 11.21 to 4.93, ROE from 27 to 19. Interest expense has risen from $397 million to $879 million. Debt/equity is 225%. I could go on but I think you get the picture. The company has not performed well over the last 5 years and it has ramped up debt to pay an increasing dividend; a pretty typical financial engineering blueprint for a mature company these days. The stock is near an all time high although I’ll grant you that its performance has lagged the S&P 500 somewhat. This is what you get when you hold interest rates too low for too long. The company? That is none other than Coca Cola. Yes, I know there is more to analyzing KO than just citing these metrics. They’re executing a plan to refranchise their bottlers and that will undoubtedly unlock loads of corporate value which can justify the stock price and C-suite salaries. Hmmm. Interesting choice of words, refranchise, which isn’t an actual word that exists outside of analyst-speak. The word implies that at some point in the past KO defranchised their bottling operations. Which they did and which was also supposed to unlock shareholder value. One wonders if anyone is making any actual money here other than the executives and their bankers. But I digress…. This isn’t a new phenomenon either. Stocks, and especially the blue chips, have been expensive for a long time. I cited KMB, CL and PG as expensive in this post in late 2014 and they’ve basically done nothing since then. Yes, you’ve collected the dividend but that is kind of the point. If all you are going to get is the dividend – which for these companies ranges from a little over 2% to about 3.5% – why take the risk of holding these highly leveraged, shrinking companies? If the Fed continues to hike rates – and every indication is that Jay Powell is just as committed to that path as Janet Yellen – it won’t be very long before you can get the same 2% from a 2 year Treasury note with a whole lot less risk. By the way, the bulk of that post I linked above was about the absurdity of GoPro’s valuation. The stock at the time was around $75 versus today’s less than $9 and it is still expensive and losing money. So, valuation does matter at some point although I still think GPRO is worth zero. The larger point is that if today’s stock valuations are to prove prophetic, we need to see some sustained growth with a 3 handle or more likely a 4 handle. Stocks may believe that will happen but the bond market surely doesn’t. And while stocks have continued to make new highs since my last economic update, bonds have not responded positively to the data that is being released. The 10 year Treasury note yield fell 4 basis points over the two weeks and is lower by another 3 as I write this: |
US 10 Year Tresury Yield, Apr - Nov 2017(see more posts on U.S. Treasuries, ) |
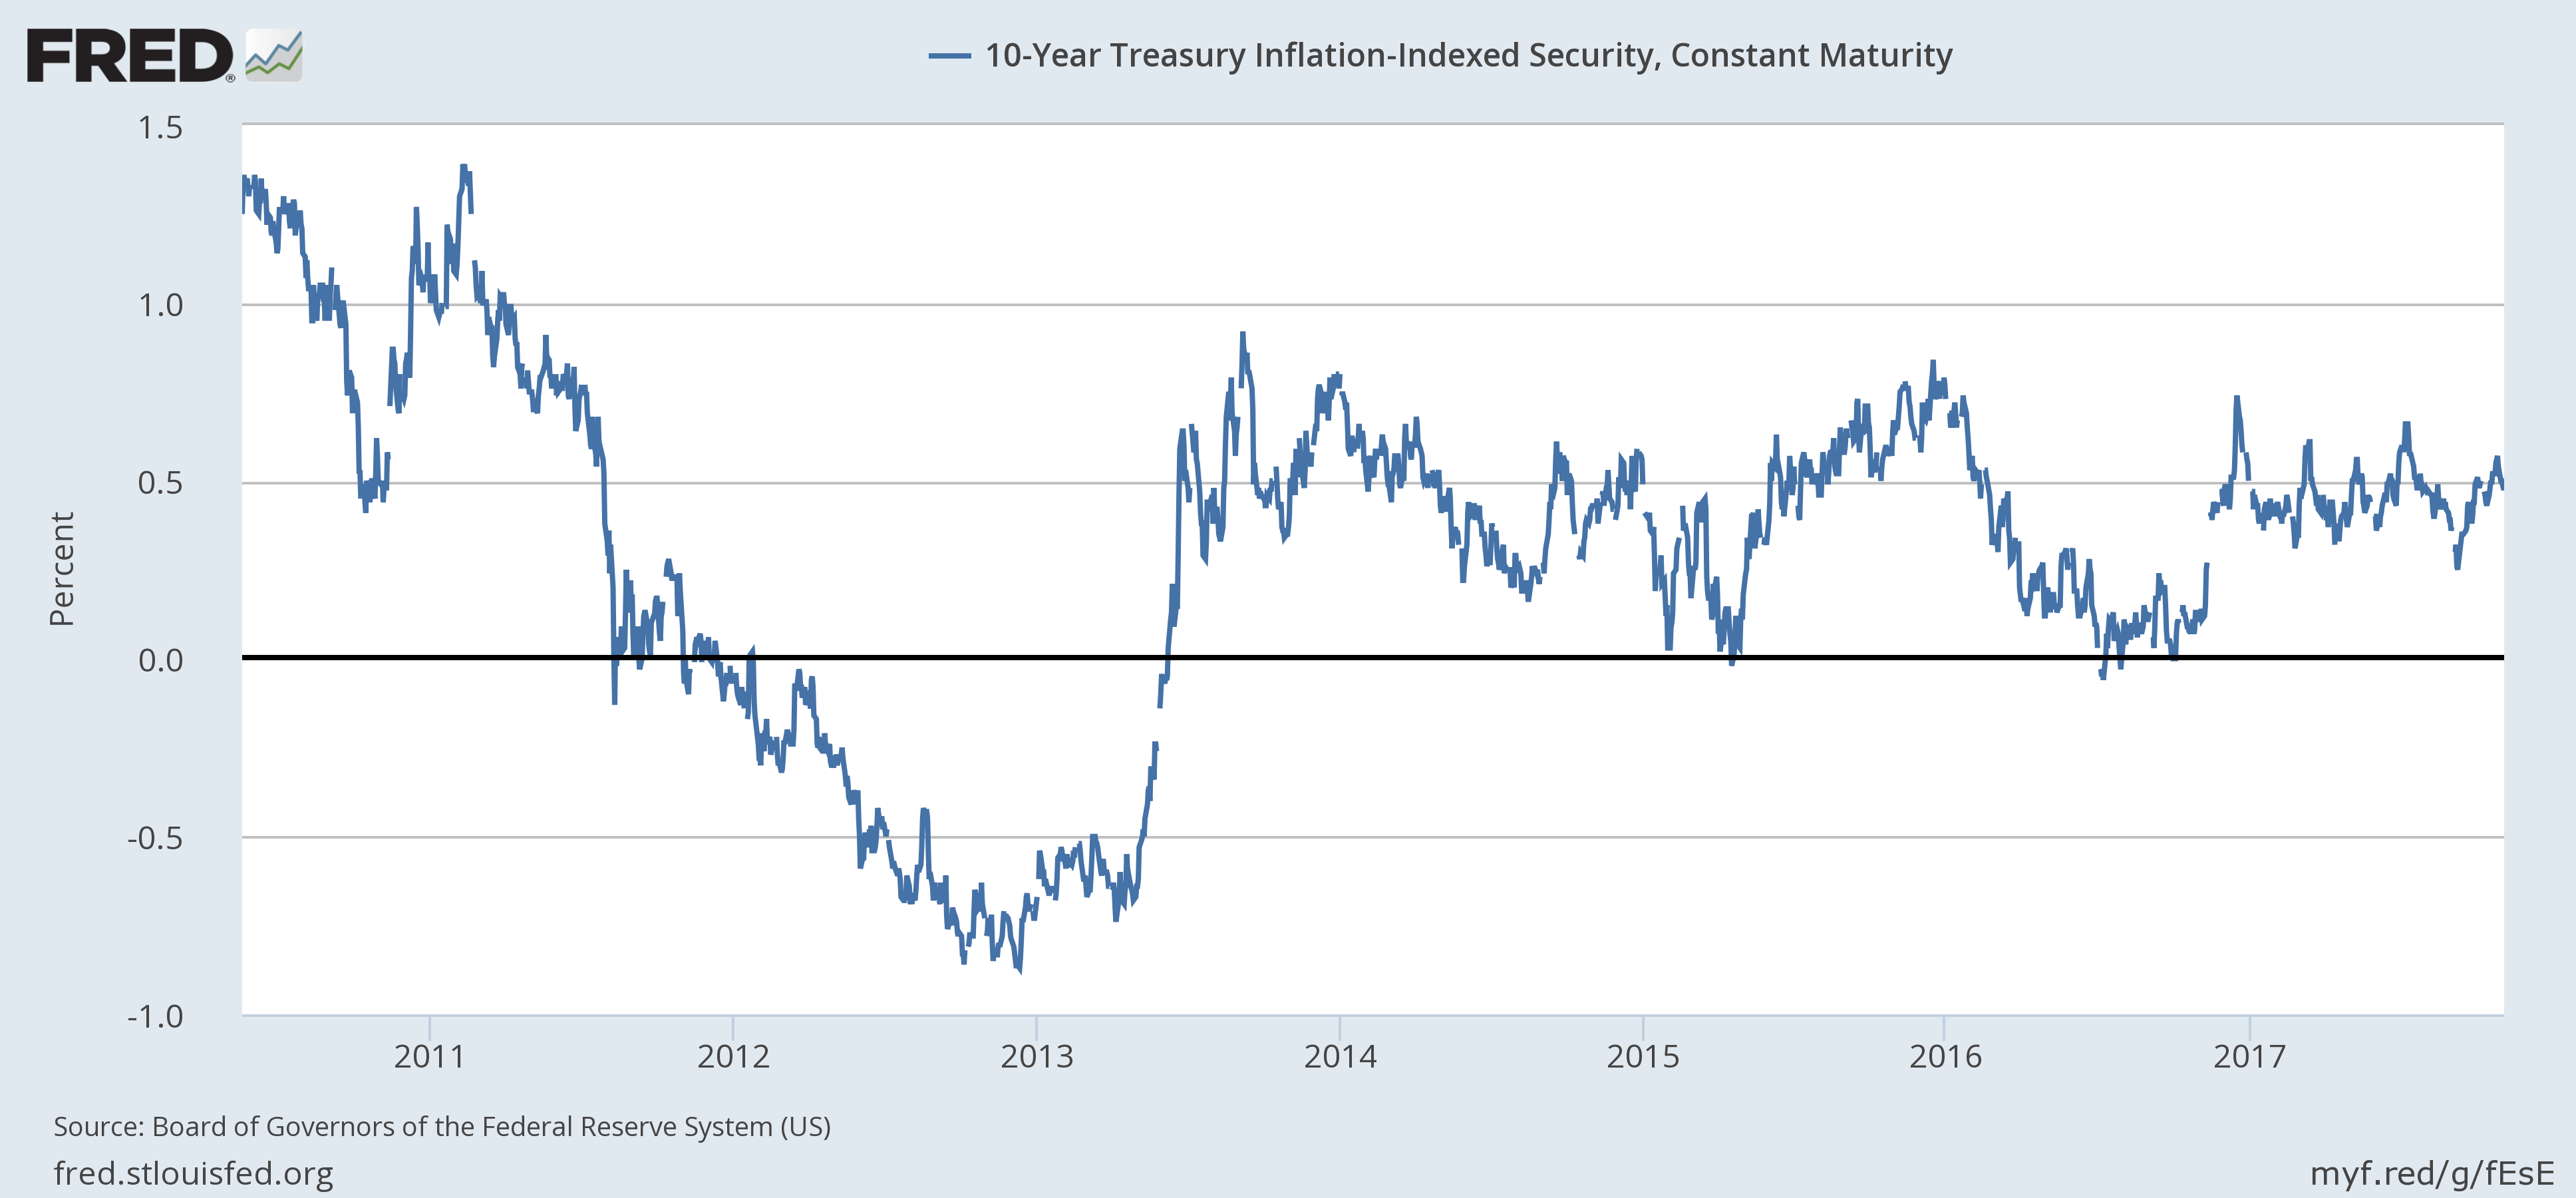
| The 10 year TIPS yield also fell 4 basis points and as you can see, is still within the tight range it has traded in now for the last four years: |
US 10 Year Treasury Inflation, 2011 - 2017(see more posts on U.S. Treasuries, ) |
| The yield curve – the best indicator of future growth – flattened by another 8 basis points, the narrowest of this cycle so far, and has broken under 70 bps today, a level not seen since just about this time of year in 2007. The curve was steepening back then however, a harbinger of recession that was fulfilled that very month. Today’s curve is pointing to weaker growth but not recession yet. |
US 10 Year Treasury Constant Maturity, 2000 - 2016(see more posts on U.S. Treasuries, ) |
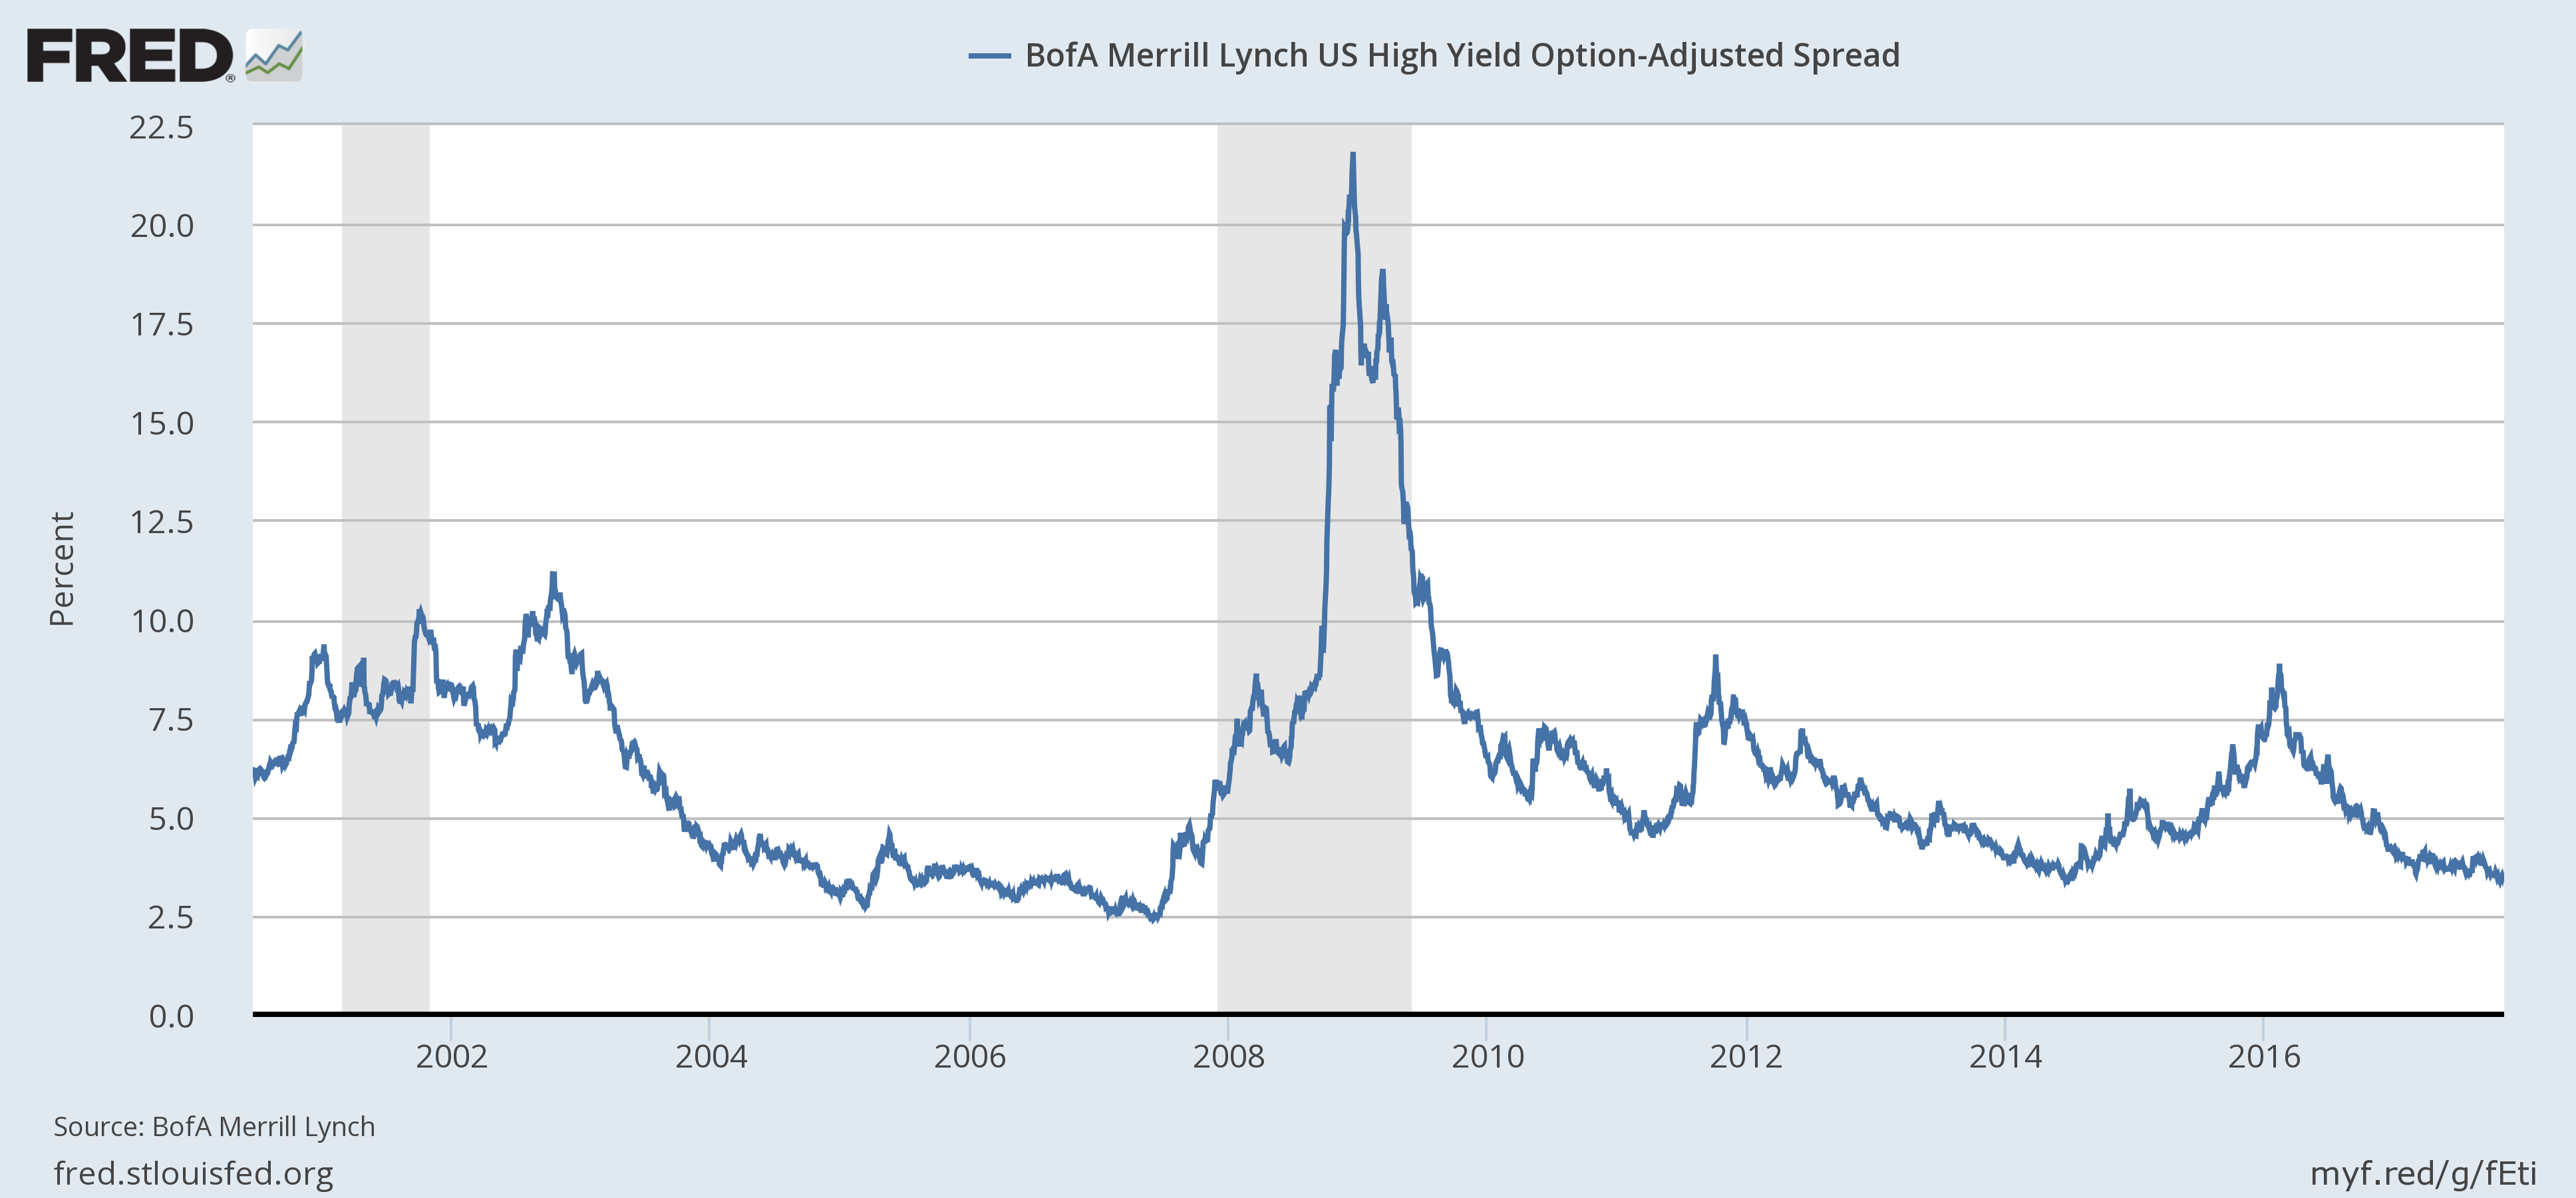
| Credit spreads also pushed toward the lows of the cycle but came up three basis points short at 3.38%. Of more interest – perhaps – is that spreads quickly widened by 17 basis points since 10/24. High yield bond prices were down last week even as stocks pushed to new highs. That may be nothing more than profit taking and isn’t enough to warrant even a warning in our process. The first warning would be a month where spreads widen by 10% from the previous month. We aren’t there yet obviously. |
US BofA Merrill Lynch High Yield Option, 2002 - 2016 |
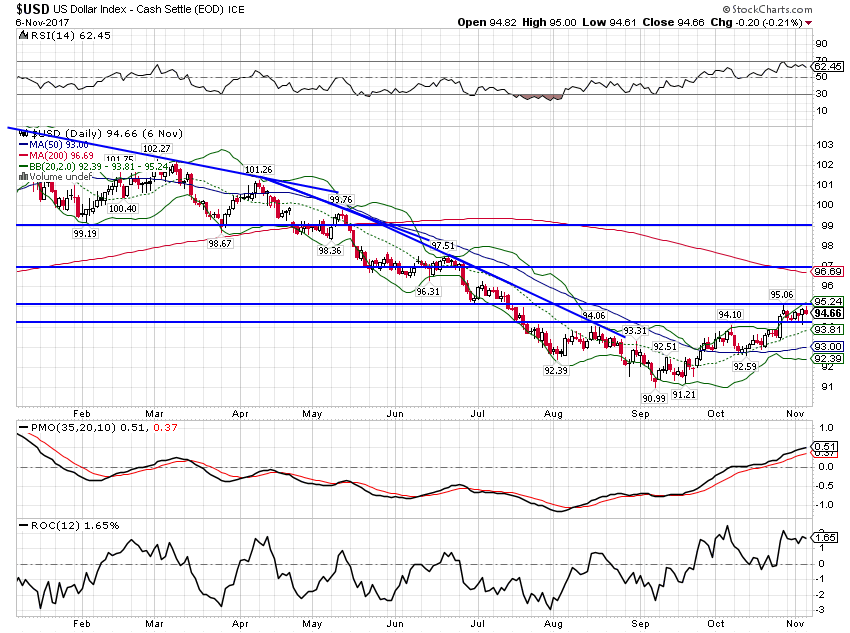
| One potentially positive sign was the stabilization of the dollar. The index moved up from 93.58 to a tad over 95 and technically could challenge 97 – 97.5. I’m a little skeptical of that but that could be because I’m long a lot of things that benefit from a weak dollar. The current consolidation is exactly what I expected and wrote about….so far. |
US Dollar Index, Feb - Nov 2017(see more posts on U.S. Dollar Index, ) |
| One sign that I may be right about the dollar – that it will resume its downtrend – is the action in gold. Despite the recent strengthening of the dollar, gold prices have not fallen. That could be because the world is still a very dangerous place – see the turmoil in Saudi Arabia last weekend – rather than a hint about the future course of the dollar. |
Gold Daily, Apr - Nov 2017(see more posts on Gold, ) |
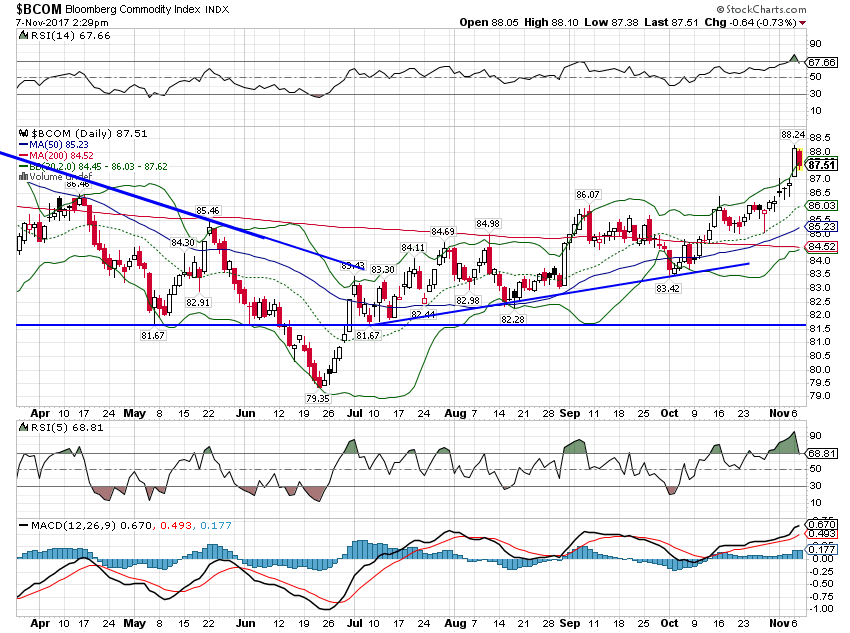
| General commodity indexes continued to rally, one of the few markets pointing toward an acceleration in global growth. A big part of that is oil prices though which are back up near $60 – and higher for Brent – and I suspect that is no longer as positive for US growth as it has been in the recent past. We have had a lot of recessions that started with high oil prices and none that I know of from prices being too low. |
Bloomberg Commodity Index, Apr - Nov 2017(see more posts on Bloomberg Commodity, ) |
Stocks are still almost alone in predicting a surge in future growth – if indeed that is what stock prices are whispering. With short term interest rates on the rise, TINA would appear to have a limited shelf life. As for the hopes surrounding tax reform, I’ve warned since the election a year ago that this wasn’t going to be easy. I said at the beginning of this year that tax reform was a 2018 event if at all and I stand by that. The bill that was recently introduced is probably already DOA in the Senate with three Republicans already publicly opposed.
Suffice it to say that it won’t survive in its current form; no bill does. What is eventually passed may have a label that says “Tax Reform” but that doesn’t make it so. Frankly, what I’ve seen so far doesn’t in any way fulfill the promise of a simpler, flatter tax code. If anything, the bill that was introduced makes the tax code more complex and involves multiple instances of favoritism. The idea that Congress will pick and choose which pass through entities will get to use the new 25% rate is anathema to small government advocates everywhere. Are new loopholes really required to close the old ones?
But let’s not get bogged down in politics too much. It is rare that anything good comes out of Washington, D.C. and this year isn’t any different in that regard. Gridlock may not solve the big problems but at least it doesn’t create any new ones. In the meantime, I’ll take my clues from the markets. Right now they aren’t predicting anything other than the maintenance of the status quo.
Tags: Alhambra Research,Bi-Weekly Economic Review,Bloomberg Commodity,Bonds,commodities,Construction,credit spreads,currencies,durable goods orders,economic growth,economy,Gold,Housing Starts,Investing,Markets,newslettersent,real interest rates,stocks,tax reform,Taxes/Fiscal Policy,TIPS,U.S. Dollar Index,U.S. Treasuries,US Dollar Index,Yield Curve


