Milestones in the Pursuit of InsolvencyA new milestone on the American populaces’ collective pursuit of insolvency was reached this week. According to a report published on Tuesday by the Federal Reserve Bank of New York, total U.S. household debt jumped to a new record high of $12.84 trillion during the second quarter. This included an increase of $552 billion from a year ago. |
United States Consumer Debt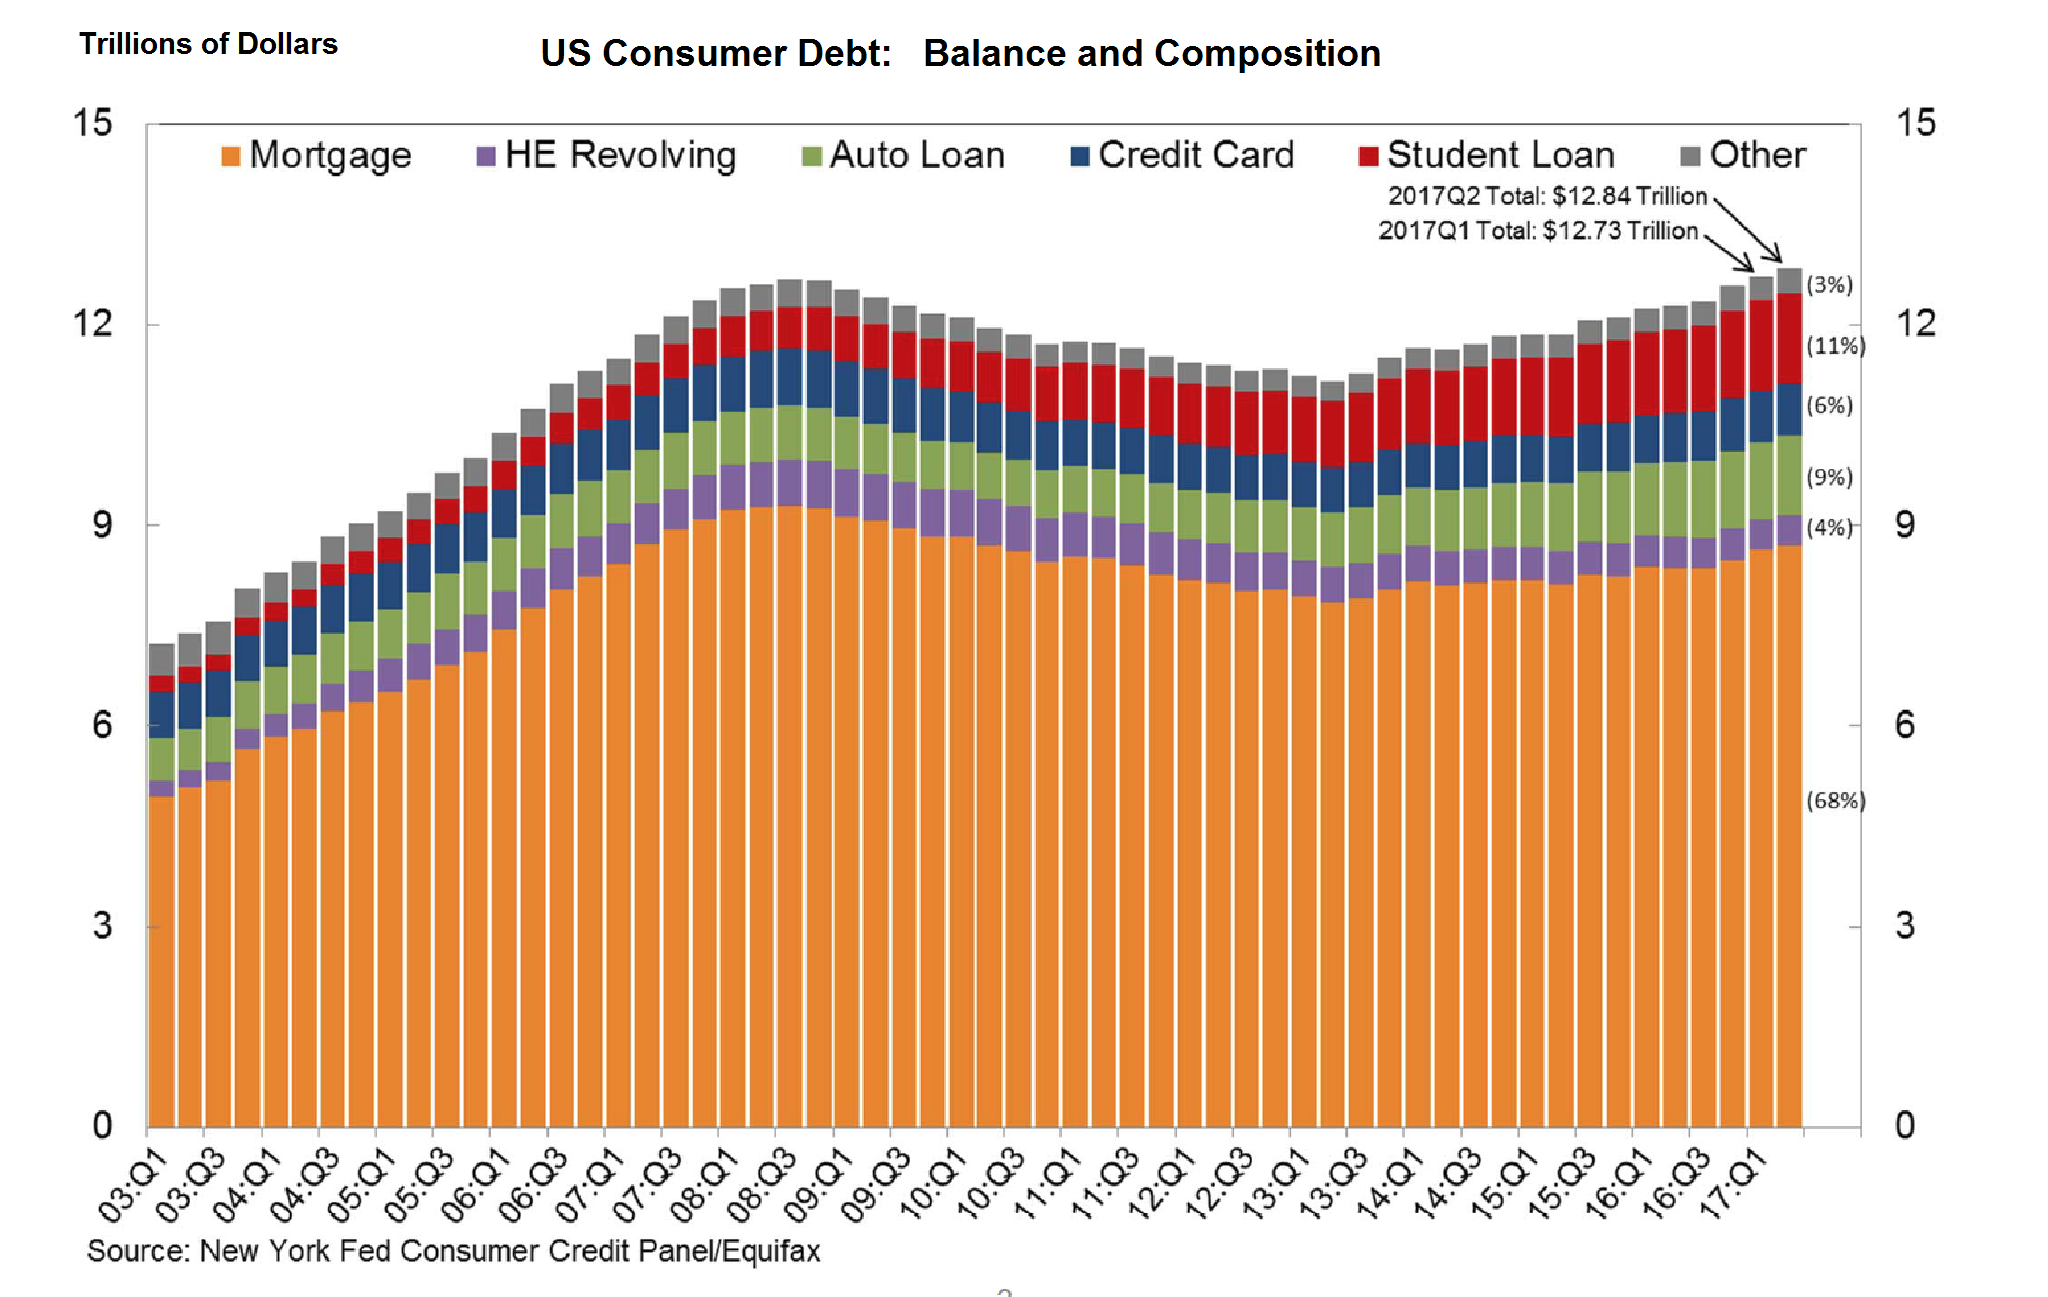 US consumer debt is making new all time highs – while this post GFC surge is actually relatively tame, corporate and government debt have in the meantime exploded into the blue yonder. Nevertheless, this means consumers are also highly vulnerable to the coming crisis (which will look different from the last one, but will be perceived as just as, if not more devastating). - Click to enlarge |
| Moreover, this marked the second consecutive record high on a quarterly reported basis for U.S. household debt. Indeed, this is a momentous achievement. From our vantage point, it is significant for several reasons.
One, it shows U.S. household debt has returned to its upward trend which had previously gone uninterrupted from the close of World War II until the onset of the Financial Crisis in late 2008. Second, it demonstrates that, like the S&P 500, new all-time highs are being attained with the seeming precision of a quartz clock. Is this just a coincidence? More than likely, it’s no coincidence at all. More than likely, the mass quantities of central bank liquidity that have been injected into the financial system over the last decade have provided the plentiful gushers of cheap credit that have pushed up both stock prices and household debt levels. But remember, the easy stock market gains can quickly recede while the increased debt must first drown the borrowers before it can be expunged. To understand where the liquidity has come from, look no further than the total combined assets of the Federal Reserve, European Central Bank, and the Bank of Japan. They were around $4 trillion a decade ago. Today, they’re over $13.8 trillion. And if you include the People’s Bank of China’s assets, combined major central bank assets jump to nearly $19 trillion. |
Total Assets of major central banks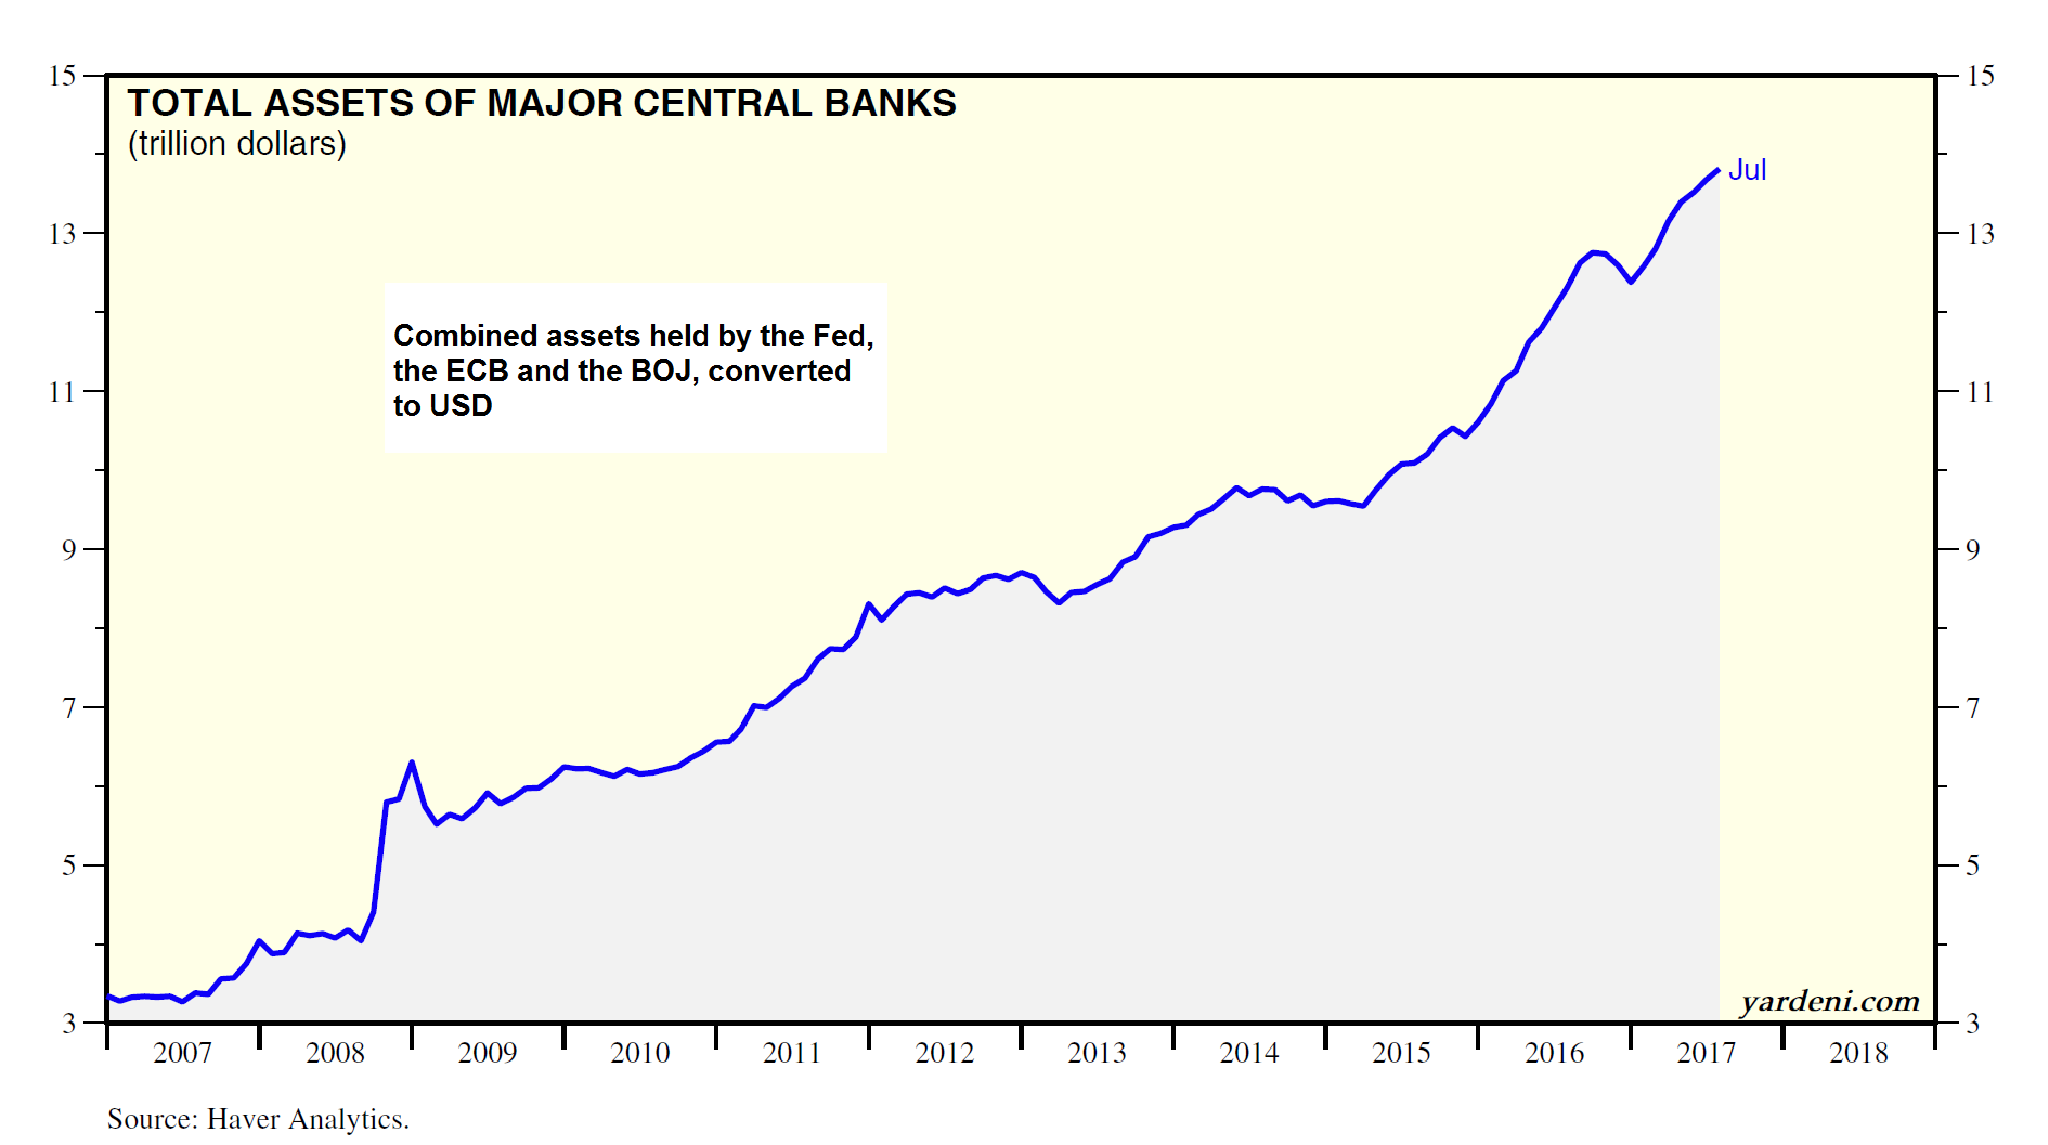 Central bank balance sheet expansion: even though assets held by the Fed have remained stable since QE3 ended in 2014, the giant debt monetization programs pursued by the ECB and the BoJ have pushed the total up rapidly. Note that this is reflected in money supply growth in these currency areas as well – it is not just central bank balance sheets that have expanded. - Click to enlarge A major goal was to lower market interest rates, which does of course require more money being made available to the economy, even if it was done in unorthodox fashion in this case. From a theoretical standpoint it should be noted that the effect of direct central bank money supply expansion and the usual way of expanding the money supply by inflating commercial bank credit has made very little difference. The channels by which credit and money were expanded were slightly different, but the vast bulk of new credit still ended up in the business sector. We should therefore expect the tenets of business cycle theory to fully apply. We mention this mainly because in the early stages of the post GFC era, a case could be made that we were potentially witnessing what Mises referred to as “simple fiat money inflation”. The central bank seemed to largely fund government debt, whereas normally, newly created money would have entered the economy first and foremost through the corporate loan market. As it turned out, QE resulted in newly created money taking a somewhat more circuitous route, as corporate debt soon began to expand rapidly. |
A Gigantic LetdownOf course, record debt and record stock prices were part of the plan all along. If you recall, the clever economists at the Fed promised thehoi polloitheir cheap credit policies would rain riches down from the heavens via something they called the wealth effect. We never quite followed the logic of it all. Per the policy wizards, the wealth effect is what happens when the value of people’s assets rise. When investment portfolios bubble up, consumers feel more financially secure. Hence, they buy stuff they don’t need, and that they really can’t afford, using credit. The increase in spending, in turn, is supposed to stimulate the economy and make everyone wealthy. Yet the experience over the last 9 years tells a different story. The S&P 500 index has gone up 270 percent. However, GDP has gone up just 34 percent. On top of that, median household income has been stuck in first gear for over two decades. |
United States Broad Money Supply, Jan 2000-2017 The money supply, stocks and nominal GDP since early 2000, indexed. One might say it’s case of “not much bang for the buck” – This may indirectly validate our long-held suspicion that the economy’s pool of real funding has been in varying degrees of trouble since the peak of the tech mania in 2000. - Click to enlarge |
| Obviously, the stock market did its part by soaring to record highs. And consumers did their part, by spending their way to record levels of debt. The economy, on the other hand, lunged and lagged. In short, the wealth effect was a gigantic letdown.
On top of that, the Fed now plans to normalize its balance sheet. That’s what they say, at least. This week the July FOMC minutes were released and included a strong consensus for the Fed to begin reducing its $4.5 trillion balance sheet “relatively soon, absent significant adverse developments in the economy or in financial markets.” |
United States True Broad Money Supply, Jan 2000-2017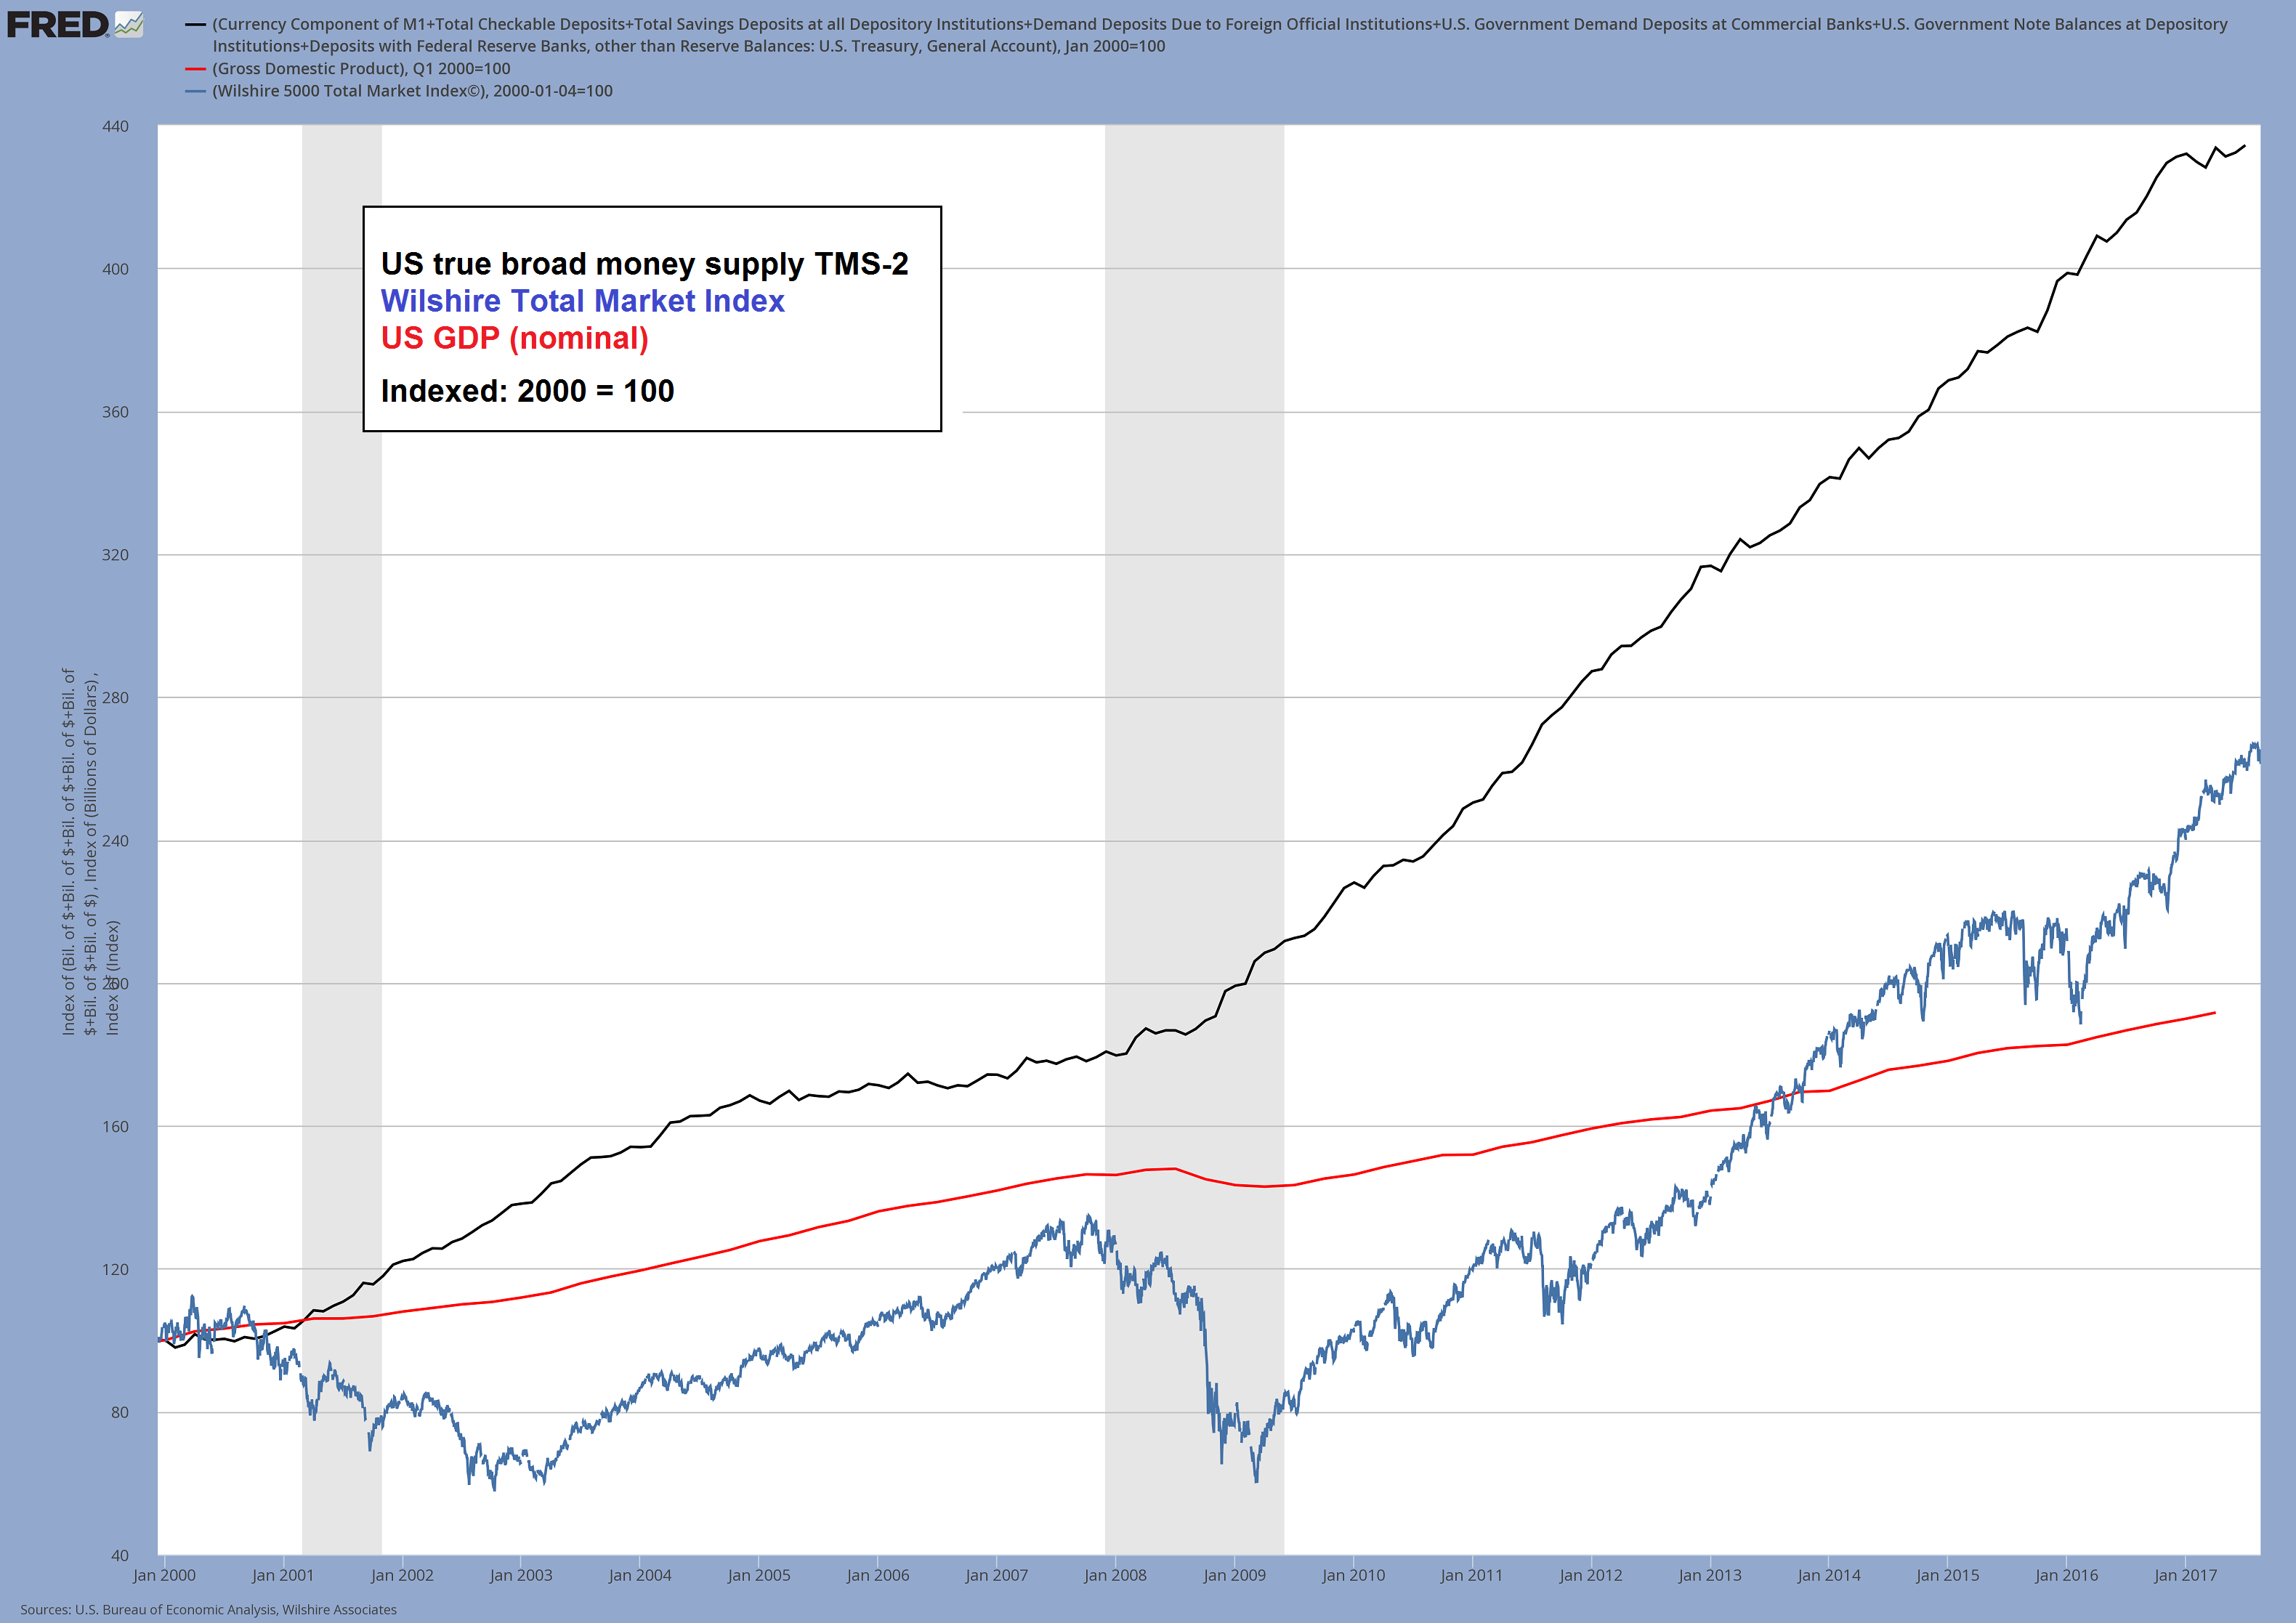 The same chart as above, but this time indexed to March 2009, when the stock market made its post-GFC lows. One can certainly blow asset bubbles by printing money, but one cannot create a single iota of real wealth that way. Note in this context that nominal GDP growth is for the most part an artifact of monetary inflation as well. Those who own assets the prices of which have risen since 2009 certainly “feel” as though they are richer at the moment, but most of this is actually phantom wealth. - Click to enlarge It cannot be realized – the moment a critical mass of people tries to do that, it will disappear into a bid-less black hole. Conversely, there is a chance that the effect of monetary inflation will eventually spill over into other things than asset prices. Whether and to what extent that happens depends at least in part on contingent circumstances that cannot be foreseen. From a business cycle perspective one could argue that a misallocation of scarce resources away from lower to higher order goods production will eventually resolve in bottlenecks at the consumer product stage, which may well trigger a more broad-based decline in the purchasing power of fiat money (then again, the effect could be overwhelmed by the need to pay back debt and obtain liquidity – much will depend on how the authorities respond to the crisis once it breaks out). Concurrently, neglect of capital maintenance, a surfeit of semi-finished goods which are actually not needed (as demand for the final goods produced with their help is far smaller than expected) and a shortage of complementary goods needed to produce the types of final goods for which demand is actually strong, will all surface in the higher order and medium order stages of the capital structure, revealing the economic disarray created by yet another period of manic credit expansion. |
| Here at the Economic Prism we watch intently for the Fed to commence its adventures in quantitative tightening. We have an inkling the unwind will be more disruptive than the Fed advertises. Plus, we have doubts the Fed will ever make substantial reductions in its balance sheet before they’re compelled to further expand it due to “significant adverse developments.” |
Real Median Household Income 1999-2015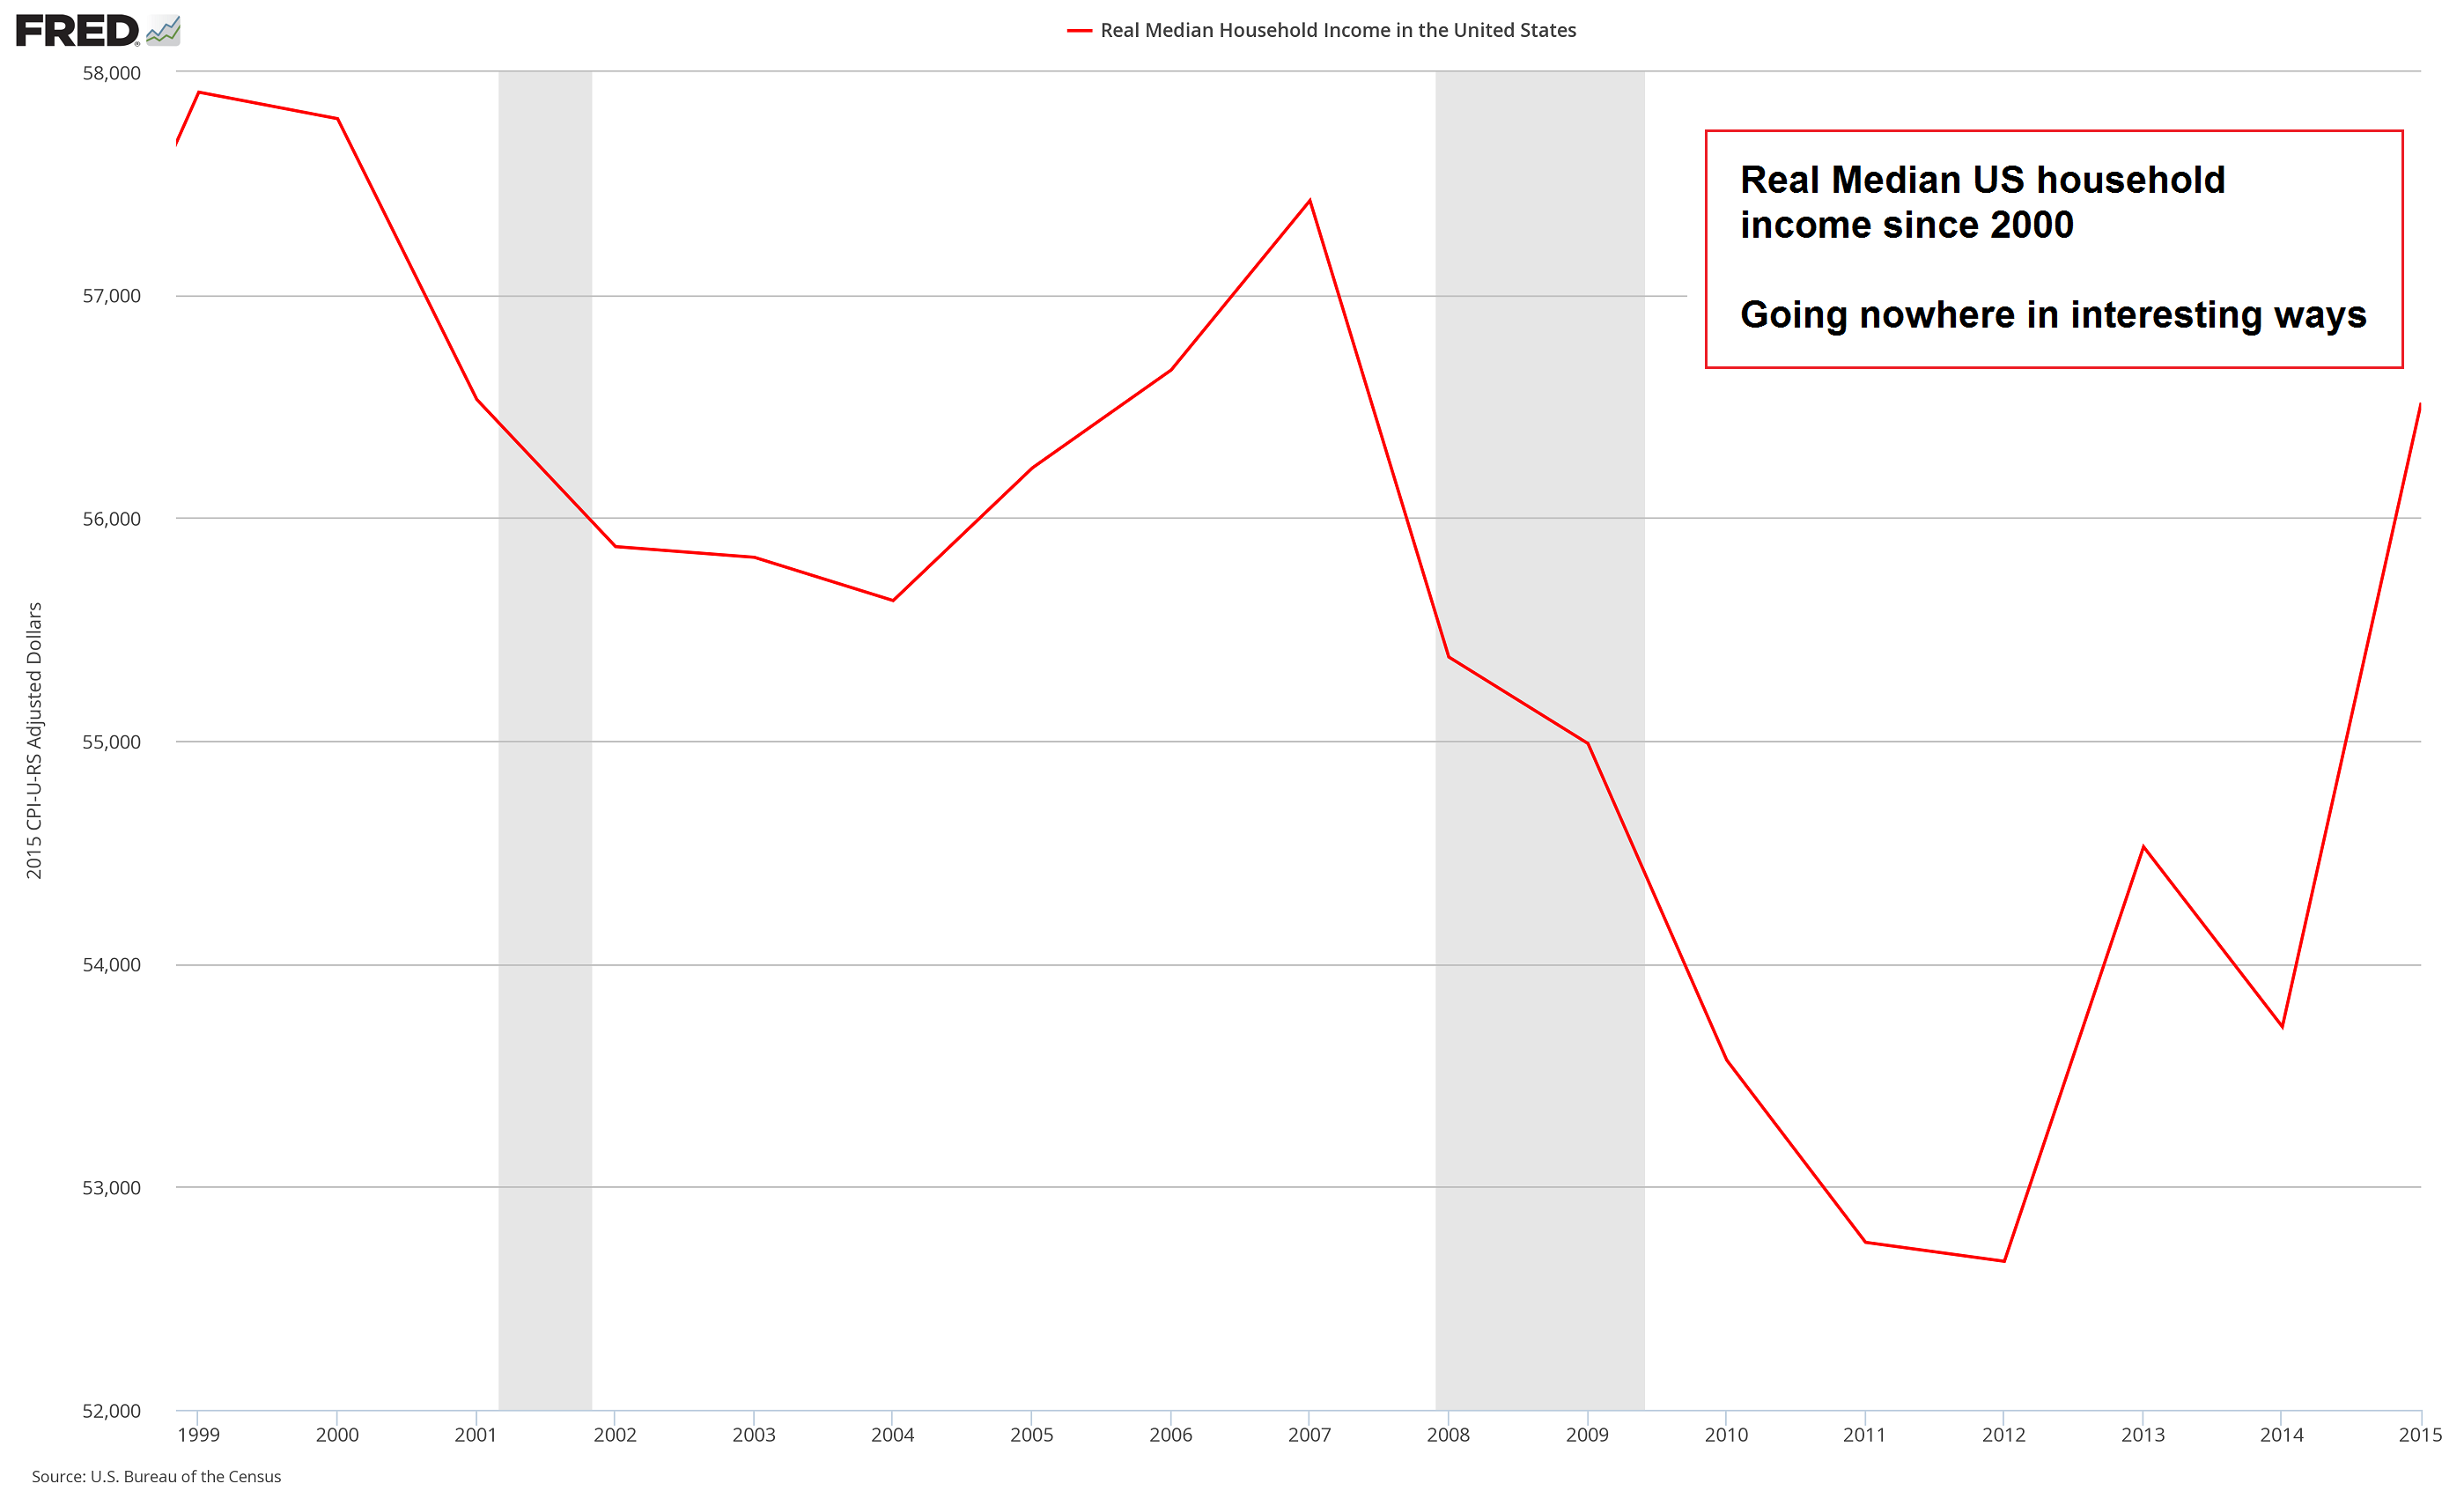 This chart shows that real median household incomes have yet to return to levels last seen in the year 2000. For all the faults of such aggregate measures, this trend is definitely in line with the effects one would expect money printing to bring about – based on sound economic theory, that is (which means Fed members can’t explain it). - Click to enlarge |
Why There Will Be No 11th Hour Debt Ceiling DealConsider that the stock market is poised for a crash like never before. Consider, too, that over the past week – even with yesterday’s sell-off – the stock market has shrugged off the North Korea nuclear threat, major civil division, and the collapse of retail, as though these doom scenarios were merely the 24-hour flu. But will the stock market shrug off the next major financial epidemic that is developing? While Congress is vacationing on summer recess, a massive fiscal disorder is patiently waiting to bum-rush them upon their return.As the Business Insider explains:
Sure, Congress has always come together at the 11th hour in the past. They’ve raised the debt ceiling 78 times over the last 57 years. So, won’t they just raise it again? |
 How to deal with the national debt – once it achieves orbital velocity, it will be appropriately impressive. Besides, as Paul Krugman would remind us, “we owe it to ourselves”. The ceiling obviously stands in the way of achieving orbit. - Click to enlarge As Ludiwg von Mises reminds us though: “At the bottom of the interventionist argument there is always the idea that the government or the state is an entity outside and above the social process of production, that it owns something which is not derived from taxing its subjects, and that it can spend this mythical something for definite purposes. This is the Santa Claus fable raised by Lord Keynes to the dignity of an economic doctrine and enthusiastically endorsed by all those who expect personal advantage from government spending. As against these popular fallacies there is need to emphasize the truism that a government can spend or invest only what it takes away from its citizens and that its additional spending and investment curtails the citizens’ spending and investment to the full extent of its quantity.” |
| This time around, we have some reservations. Quite frankly, this Congress has proven that it is not motivated to do what’s best for the American people. Each representative has an illogical logic unto himself. Just ask John McCain – he doesn’t know what he wants until the precise moment he votes. |
What’s more, these days the debt ceiling has become ultra-politicized in Congress. Big time horse trading must first take place before an agreement can be reached. Big time bluster and chest pounding must take place too.
The point is, over the past six months this Congress has been incapable of getting a doggone thing done. What makes you think they will somehow get their act together in just 12 days?
Charts by: NY Fed, Ed Yardeni / Haver Analytics, St. Louis Fed
Chart and image captions by PT
MN Gordon is President and Founder of Direct Expressions LLC, an independent publishing company. He is the Editorial Director and Publisher of the Economic Prism– an E-Newsletter that tries to bring clarity to the muddy waters of economic policy and discusses interesting investment opportunities.
Full story here Are you the author? Previous post See more for Next postTags: Chart Update,newslettersent,On Economy,On Politics


