Keith Weiner
My articles My offerMy siteAbout meMy videosMy books
Follow on:LinkedINTwitterSeeking AlphaFacebookAmazonGoogle +
| The price of silver has been going down, and then down some more. From over $28 a year ago, and over $26.50 a month ago, it’s now at a new low under $22.50. Four bucks down in a month.
However, it’s been behaving differently than gold behind the scenes. Let’s look at the gold and silver basis charts to see. Gold Fundamentals – Gold Basis AnalysisThe gold basis (i.e. abundance to the market) was humming along around 0.5%. Then, as the price began to rise, it rose also, now around 1.5%. Gold would seem to be more abundant, first with a higher price (inverse to the price of the dollar, as measured in gold, indicated on the chart). Now, the gold basis is showing that it still looks abundant, even at a lower price. |
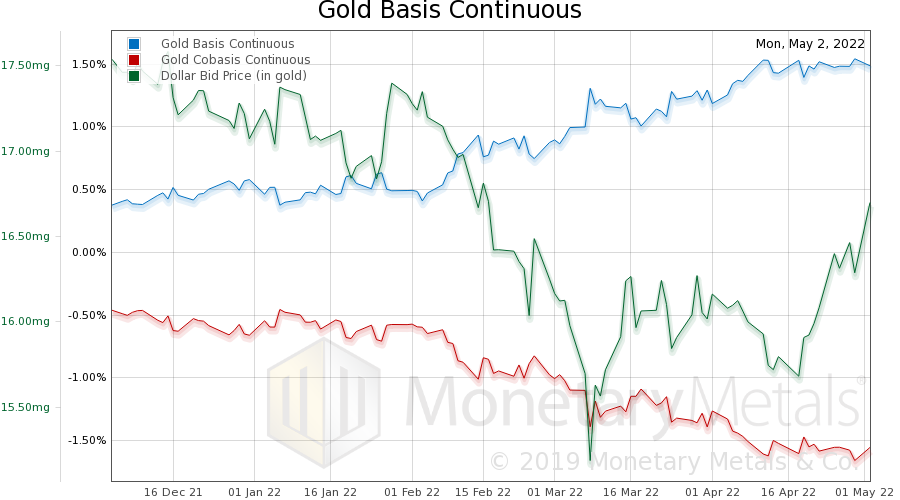 . |
Now look at silver.
Silver Fundamentals – Silver Basis AnalysisThe silver basis also rises around the same time. But, it has fallen back to around the same level as before, under 1%. We said gold “would seem” to be more abundant. However, something else changed during this time. The Fed hiked interest rates. The Fed does not control LIBOR (the London Inter Bank Offered Rate), but LIBOR tends to go with the Fed Funds Rate. And LIBOR went up a lot—from around 0.3% to around 1.3%. Recall that the basis is set by the marginal arbitrager, who carries gold. Speculators bid up futures contracts. Then the arbitragers borrow (at LIBOR), buy gold metal, and sell futures. They do this to make a small spread. If the interest rate is higher, they don’t make a profit unless the basis spread is wider. The gold basis is not up as much as LIBOR. The silver basis is even more telling. |
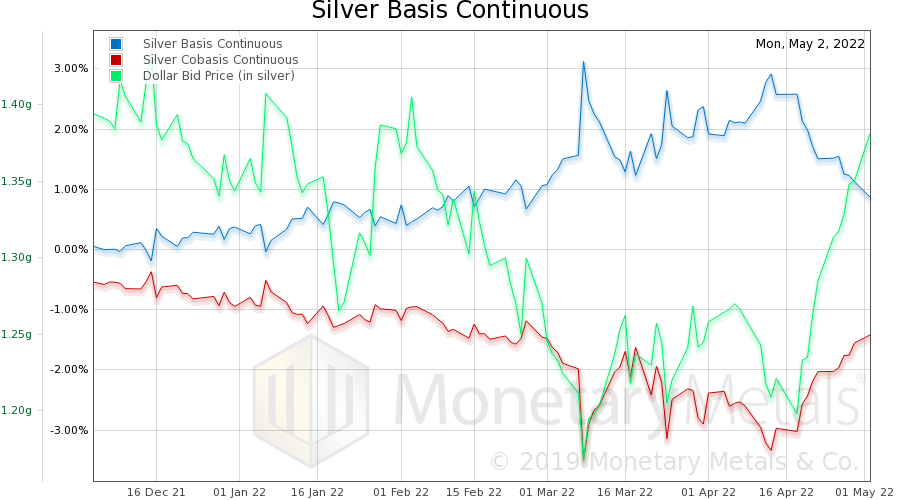 . |
Comparing Precious Metal FundamentalsLet’s look at (one-year) graphs of the Monetary Metals fundamental prices of both metals.
|
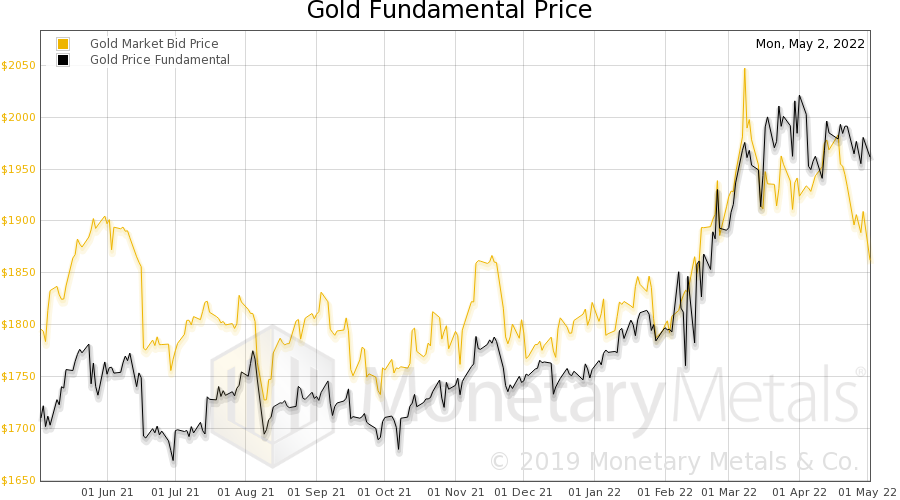 . |
| The fundamental price (black line) is only down a hair from its high last month, and still near $2,000. |
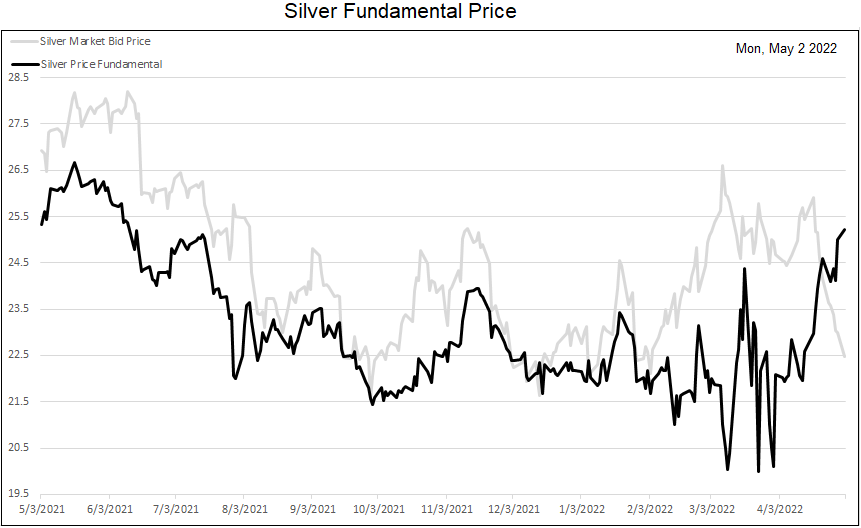 . |
The silver fundamental is up considerably from recent levels, and nearly to where it was a year ago—well over $25.
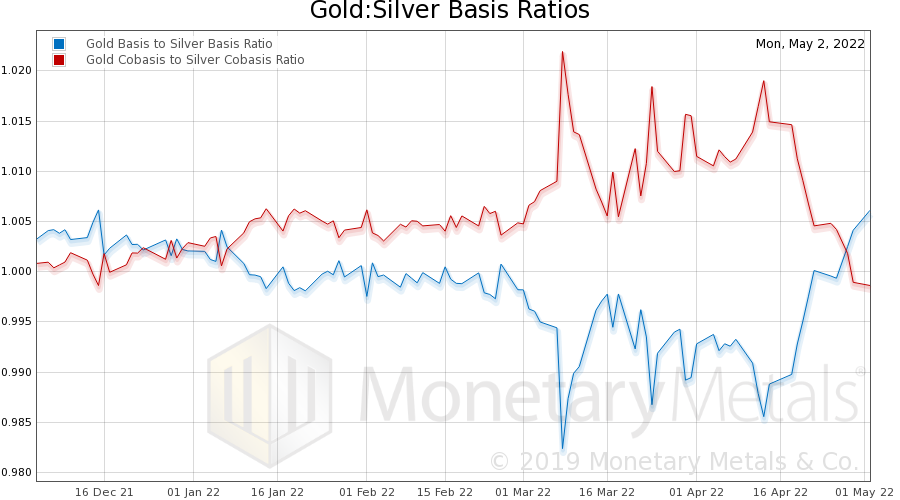
So, Is It a Good Time for a Silver Trade?Let’s look at one other chart. This is the ratio of the gold basis to the silver basis, and the ratio of the gold cobasis to the silver cobasis. When the red line is above the blue line, gold is the scarcer metal to the market. Now this has flipped, and the spread is wider than it’s been in years. This may be a good time for a silver trade. Not only are the fundamentals looking better for silver relative to gold, but the gold-silver ratio is over 82. Make sure to subscribe to our YouTube Channel to check out all our Media Appearances, Podcast Episodes and more! |
 . |
The New Way to Hold Gold and Silver
How do conventional precious metals investments stack up to Monetary Metals’ investments? Click the link below to find out.
In this paper we look at how conventional gold holdings stack up to Monetary Metals Investments, which offer a Yield on Gold, Paid in Gold®. We compare retail coins, vault storage, the popular ETF – GLD, and mining stocks against Monetary Metals’ True Gold Leases.
Full story here Are you the author?
Tags: Basic Reports,Blog,Featured,newsletter