


Keith Weiner
My articles My offerMy siteAbout meMy videosMy books
Follow on:LinkedINTwitterSeeking AlphaFacebookAmazonGoogle +
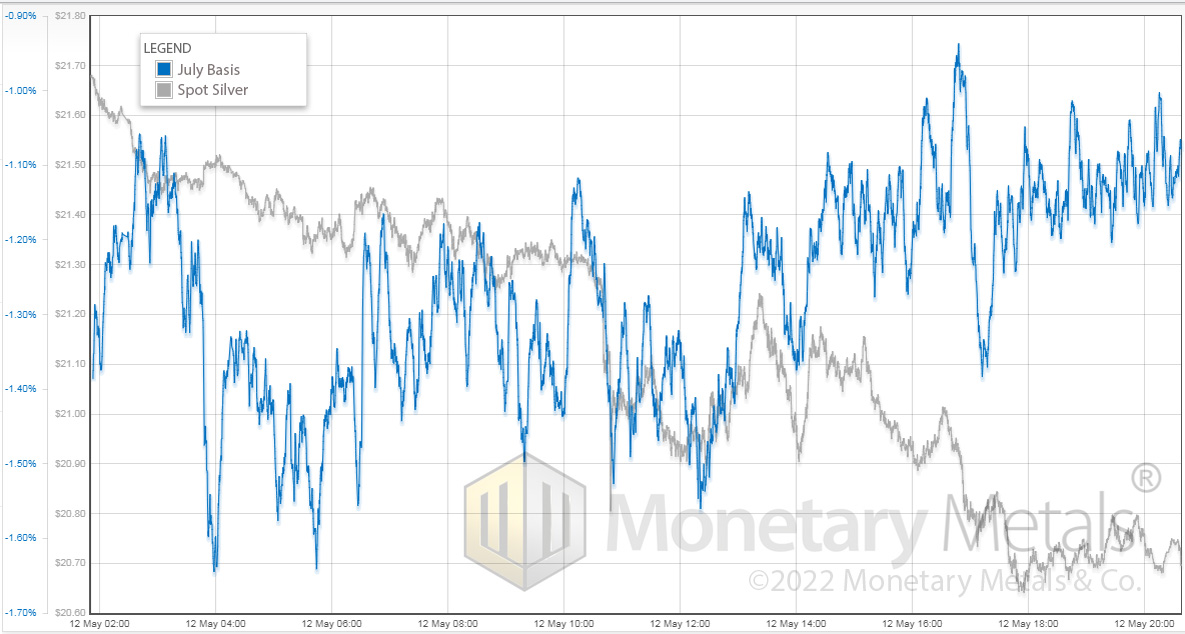
| On Thursday May 12, the price of silver fell about a buck. As with every one of these big price moves, the question is: what really happened? Below is a chart of the day’s action, with price overlaid with basis. Basis = future – spot. It is a great (i.e. the only) indicator of abundance or scarcity of metal to the market. However, here we are using it for a different, simpler purpose. We want to see the relative moves in the spot price and the near futures contract price (i.e. July).
The day was mixed. Before noon (times are GMT), the basis is volatile but tends to fall with the falling price. The basis drops from around -1.1% to -1.5%. But after noon, something changed. We see falling price and rising basis. The basis tends to follow the shape of the price line, but wends its way up as the price continues to fall. The day ends, with the basis at or above the level where it began, but the price is far below. |
 . |
The Basic Theory Behind the Market Complexity
There is a theory which is often touted in the precious metals community.
According to this theory, the banks sell futures to manipulate the price. That is, they do so without means or intent to deliver the metal. There’s lots we could say about this, but for today let’s focus on one thing.
The price of a futures contract did not move relative to the price of metal.
If the banks were dumping paper contracts, then the price of these contracts would move down relative to spot. As we see on this chart, that is not how the action went down on Thursday. The conspiracy mongers don’t want you to see this chart.
Markets are complex. There is not only a large number of participants, but also a large variety in the kinds of participants. It’s not “stackers vs. banksters”. That’s what makes it so fascinating to study them, and to trade when you can find a good setup.
Monetary Metals is Hiring! Click here to see our latest open position.
Make sure to subscribe to our YouTube Channel to check out all our Media Appearances, Podcast Episodes and more!
Additional Resources for Earning Interest on Gold
If you’d like to learn more about how to earn interest on gold with Monetary Metals, check out the following resources:
In this paper we look at how conventional gold holdings stack up to Monetary Metals Investments, which offer a Yield on Gold, Paid in Gold®. We compare retail coins, vault storage, the popular ETF – GLD, and mining stocks against Monetary Metals’ True Gold Leases.
The Case for Gold Yield in Investment Portfolios
Adding gold to a diversified portfolio of assets reduces volatility and increases returns. But how much and what about the ongoing costs? What changes when gold pays a yield? This paper answers those questions using data going back to 1972.
Full story here Are you the author?
Tags: Basic Reports,Featured,newsletter


