


Jeffrey P. Snider
My articles My offerMy siteAbout meMy videosMy books
Follow on:LinkedINTwitterSeeking Alpha
Securities lending as standard practice is incredibly complicated, and for many the process can be counterintuitive. With numerous different players contributing various pieces across a wide array of financial possibilities, not to mention the whole expanse of global geography, collateral for collateral swaps have gone largely unnoticed by even mainstream Economics and central banking.
This despite the fact, yes, fact, securities lending was the epicenter of the 2008 “somehow” Global Financial Crisis; a crisis that was, in its very essence, an interbank run on collateral. AIG, Bear Stearns, all the famous names now penned into infamy, made infamous by inability to source collateral once what was supposed to be the safest part of the system went sour.
And the most widely known of them all, Lehman, had the extra flair of triparty repo.
There are, as I started, so many “ins and outs” to the whole that its difficult to parse the details and distill them down into a basic synopsis. Still, if forced to do it, the Lehman Brothers saga might best be summed up as follows:
A couple hundred billion in “secured loans” secured by collateral JPM knows doesn’t have much of a functioning market. Does JPM, having done the Fed a huge favor with Bear, really want to be in that kind of a situation? Would it want to risk even the slightest chance to be near the edges of anything resembling that situation?
No. It would demand, and begin seizing, only the best collateral (collateral calls – and not just to Lehman) to make any estimated or even perceived potential shortfall. And that’s exactly what it did – at the same time everyone else was doing mostly the same thing.
The nearly useless Financial Crisis Inquiry Commission gathered a wealth of information and internal communications (its only use; the conclusions reached merely ended up mimicking the prevailing establishment blame anyway, subprime mortgages, despite all its findings proving beyond doubt that wasn’t the actual problem), and specifically mentioned how in the week before the “bank’s” failure Lehman had been pressed by all of its repo counterparties to post more collateral via JP Morgan as main triparty custodian.
On Monday, September 8, more than 20 New York Fed officials were notified of a meeting the next morning “to continue the discussion of near-term options for dealing with a failing nonbank.” They received a list documenting Lehman’s tri-party repo exposure at roughly $200 billion. Before its collapse, Bear Stearns’s exposure had been only $50 to $80 billion. The documentation further noted that 10 counterparties provided 80% of Lehman’s repo financing, and that intraday liquidity provided by Lehman’s clearing banks JP Morgan, primarily could become a problem. Indeed, JP Morgan, Citigroup, and Bank of America had all demanded more collateral from Lehman, with the threat they might “cut off Lehman if they don’t receive it.”
The utterly useless Federal Reserve believed a new crisis policy put in place after Bear would adequately answer for this particular snafu should the situation ever arise, something called the Primary Dealer Credit Facility (PDCF). When, in fact, the PDCF merely demonstrated for the nth time how little policymakers understood the system officials constantly told the public they would ably defend (to understand more about why the PDCF was ill-suited, thus ill-fated, the complete story behind it and Lehman’s triparty collapse is here).
OK, but what is triparty repo?
The majority of repurchase agreements, really collateralized short-term lending, are done between just two counterparties – bilateral and bespoke. That’s the repo we can’t really see because other than the two counterparties involved, we really won’t know anything about the transaction unless it happens to take place across quarter-end or some other reporting period date.
In this bilateral shadow repo, the two parties have to find each other – the one with spare “cash” and the other with some form of collateral the cash lender finds amenable to its risk-aversion (can it reliably liquidate the collateral should the cash borrower default, and in what likely price range?) Typically, they already have done business and know each other.
Triparty repo is when some custodian bank stands in between the cash lender and cash borrower, doing so to more efficiently match one with the other (for a small fee) and maintaining the books and upkeep on each’s behalf. Rather than customized one-to-one, cookie-cutter mass repo across the whole range of potential participants.
For most of the repo market’s history, that was JP Morgan (along with Bank of New York).
As triparty custodian, however, this third participant though in between counterparties who bear (pun intended) ultimate recourse does take on some risks. The Fed’s PDCF did little to mitigate them:
What really happens is quite different; was quite different. Again, even the hint, the smallest perception of being stuck with collateral that may not be reliably liquid, investors pull, they demand instead only collateral that is reliably liquid – and not just from the one questionable dealer – leaving the triparty custodians (where there even is one) to begin protecting themselves from any fallout of what is instead an interbank run on collateral.
As with its securities lending data I discussed in yesterday’s Part 1 for the collateral case, the Federal Reserve also through its New York branch keeps tabs on triparty repo. Unlike its securities lending, it took GFC1 for FRBNY to begin doing so (an all-time “oops”). Then also like the securities lending figures, the Fed has little to no idea what the data really means.
I went over these numbers last year, so if you need a refresh the links are below.
| Basically, when collateral grows scarce there will be a clear run to UST collateral for all the reasons stated above, all the many more reasons I’ve written about in other places over the many years, as well as perhaps a few more I still have to uncover. When the media calls it a flight to safety, that really just means flight to the most liquid therefore pristine collateral.
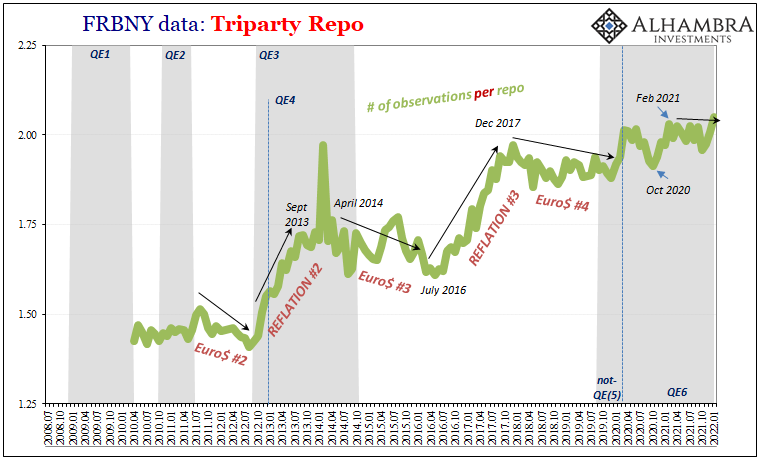
You can see this in the post-crisis triparty repo data, too. Remember, this is only one part of the repo market which we can see. In each of the subsequent dollar shortage series, beginning with 2011-12’s Euro$ #2, there’s a rise in UST collateral being posted with triparty custodians (note: JP Morgan got out of the business in 2017 leaving BNY Mellon as the last one standing, though there’s something called “sponsored repo” nowadays which is a slightly different take). |
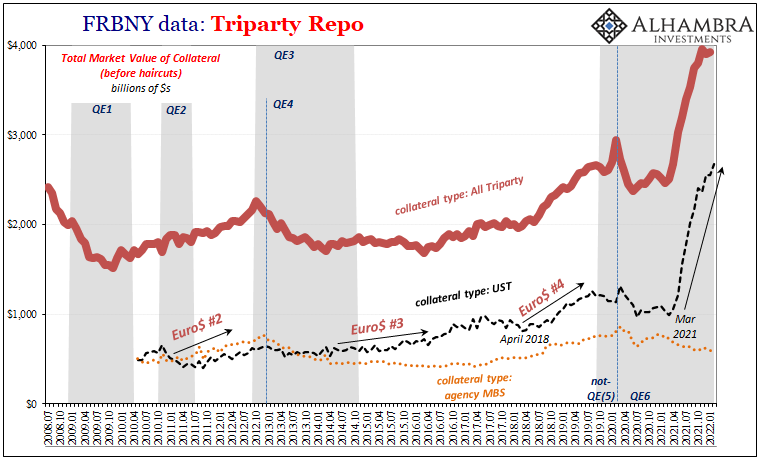 |
| This became more pronounced during Euro$ #3, and then especially so for 2018’s Euro$ #4 eruption (I’ve marked these with arrows on the chart above).
Why does the volume for overall repo rise as triparty repo participants filter more activity via UST collateral? There are no direct answers to be drawn from this data alone. However, it is quite reasonable to presume the problem lies, or at least begins, in bilateral shadow repo. Collateral problems out there in the unlit hinterlands of secured lending almost certainly marred by “too many” (my term) collateral for collateral swaps (transformations of the kind illustrated below) once unquestioned during reflation risk-taking start getting questioned resulting in disinflation and risk-aversion. |
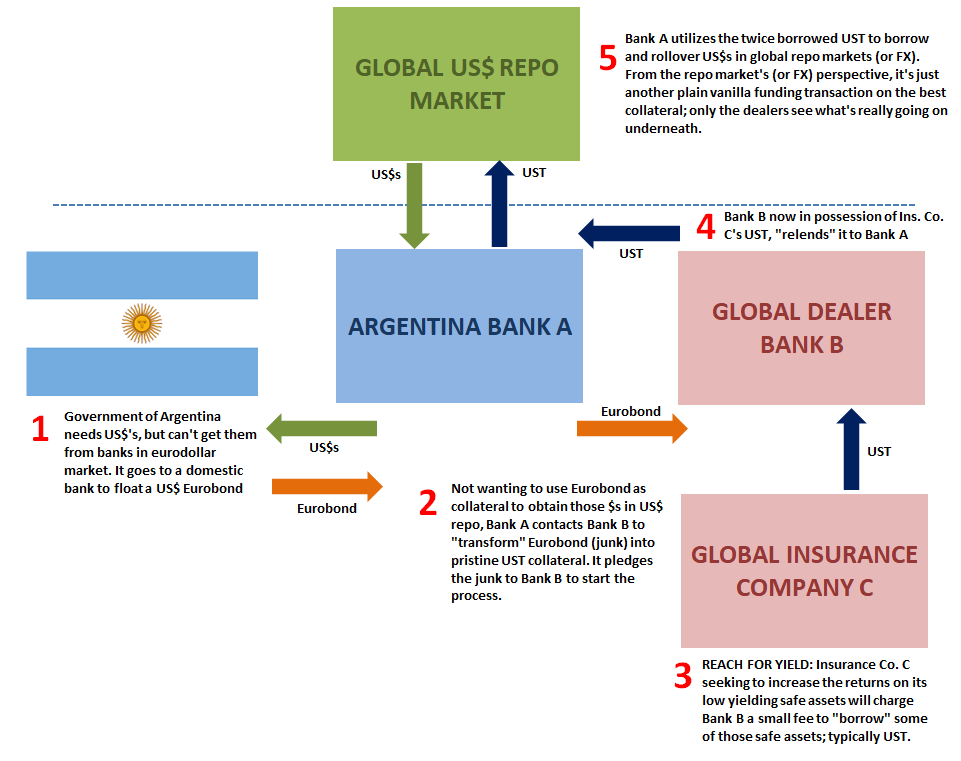 |
| Like subprime mortgages almost a generation ago, whatever kind of junk collateral being posted as an initial leg in a collateral transformation which eventually finds its way into bilateral repo cash for collateral transactions (again, see above), once doubted begins to unwind leading eventually to herd or even create a run (to varying degrees, not all collateral runs have to be September/October 2008 in their intensity and reach) toward the best collateral.
It’s a flight to repo safety which includes, these days, apparently more daylight in the form of triparty versus bilateral. Instead of more risky lending arrangements dependent upon a good bit of crap collateral when risk-taking was prevalent, as it all goes wrong those who can seek the shelter and reliability of triparty (since reformed) using USTs do so. |
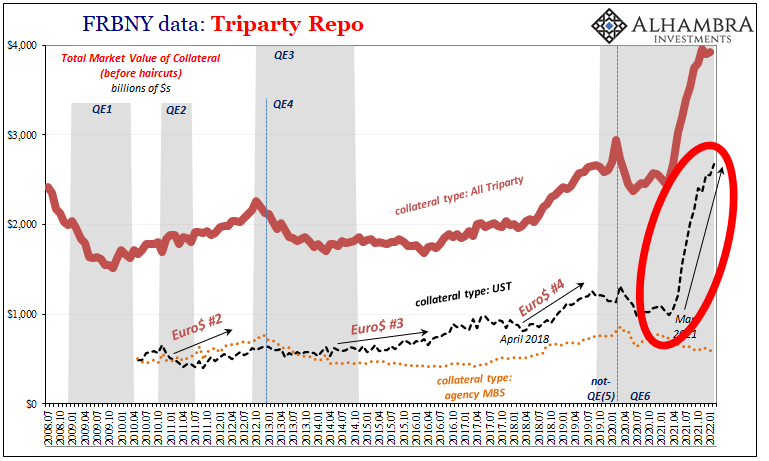 |
| If that is indeed the case for each of the post-crisis dollar shortages predicated quite a lot on collateral scarcity becoming acute, then what are we to make of March 2021 to current? You probably already noticed this above, but I’ll add it here again just for emphasis:
Seems like it might’ve been important. That’s not all, either. FRBNY’s triparty repo data also give us some backdoor sense of collateral types beyond USTs and MBS. The number of observations per repo is a quantifiable measure of how many kinds of collateral are and have been posted for a single triparty repo arrangement. Here’s how I described the data up to last April:
|
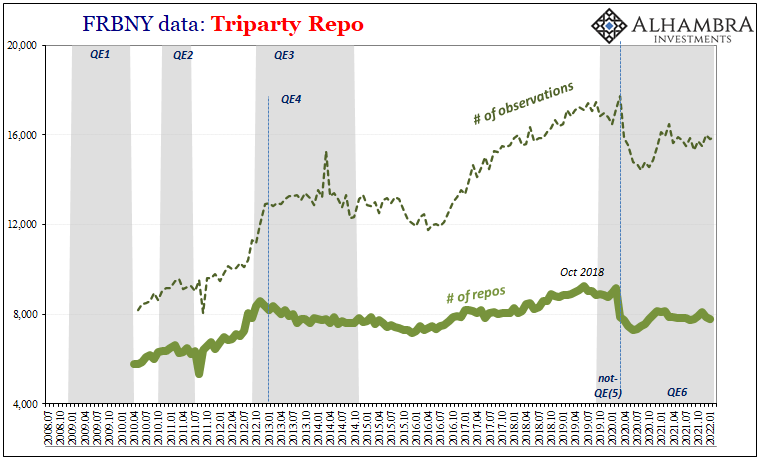 |
| The other, number of observations, refers to how many other datapoints which might be included with a repo transaction: such as the number of different types of repo collateral used in them.
If we put those two parameters together, coming up with the number of collected observations per reported number of repo transactions, what we find is almost exactly what I just described. During reflationary or “risk-on” periods, the relative number of observations per repo rises, indicating how the repo system as a whole is putting up a wider variety of collateral on average per transaction. Conversely, during dollar shortages – of which collateral has played a huge part – that average tends to decline if only somewhat. Sure enough, since last February the number of observations per repo has been declining (it rebounded a bit in the latest figures for February 2022, which is not unusual). |
 |
| Since around the top in the reflation market March 2021, when the yield curve first began to flatten (and other related deflationary market signals corroborated), the triparty repo data shows a truly massive increase in big-money volume (higher dollar volumes per each repo transaction) at the same time preferring – demanding? – only UST collateral.Given all the other concurrent market indications already indicating the near certainty for troublesome collateral scarcity, that simple, most straightforward explanation for this data fits neatly as equally indisputable. | 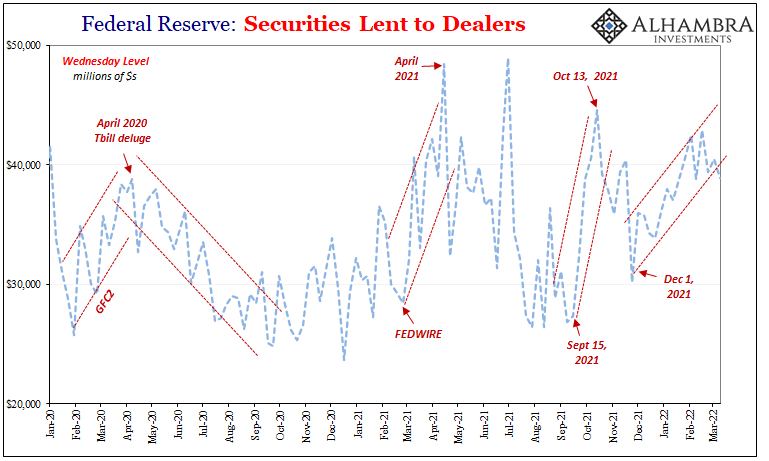 |
| It’s not one thing or other here and there, it is everything all at the same time(s).
And we don’t have to strain our imagination to figure out why this would be. On the one hand, the constant supply (of USTs) constraint particularly T-bills. On the other, despite the mainstream rhetoric about an overheated economy experiencing genuine inflation, macro downside risks have instead predominated (in many cases because of artificially higher prices being forced on consumers and businesses by a supply shock which always comes with a high potential for eventual demand destruction) on top of the clear deflationary money message sent first by Fedwire (February 24, 2021). In collateral terms, any junk that was deposited for collateral transformations during the jubilations of the second half of 2020 (Jay Powell’s buying corporates!) into the first parts of 2021 (vaccine euphoria) suddenly became suspect after Fedwire into the “growth scare” leading to the collateral system (and its multiplier) surely having, pardon another pun, tapered. |
 |
As in all historical cases all the way back before Lehman into Bear (and others like Carlyle), contracting collateral multiples means excessive demand for pristine collateral, with T-bills and OTR notes right at the top. A yield curve that before last March had steepened more optimistically (though not really all that much), suddenly stopped doing so and no matter how high each subsequent CPI has displayed a constant and increasingly more emphatic deflationary warning.
The Fed is hiking rates for what it claims is inflationary pressures, when the flat, now-inverted yield curve (7s10s, with 5s10s almost there) demands far more attention to actual money considerations all these years later those at the Fed continue to ignore.
It’s not just a collateral case for the yield curve, it is market-wide case closed.
Full story here Are you the author?
Tags: Bonds,collateral,collateral scarcity,collateral shortage,currencies,economy,Featured,Federal Reserve/Monetary Policy,Lehman Brothers,Markets,newsletter,repo,Securities Lending,T-Bills,U.S. Treasuries,Yield Curve


