


Keith Weiner
My articles My offerMy siteAbout meMy videosMy books
Follow on:LinkedINTwitterSeeking AlphaFacebookAmazonGoogle +
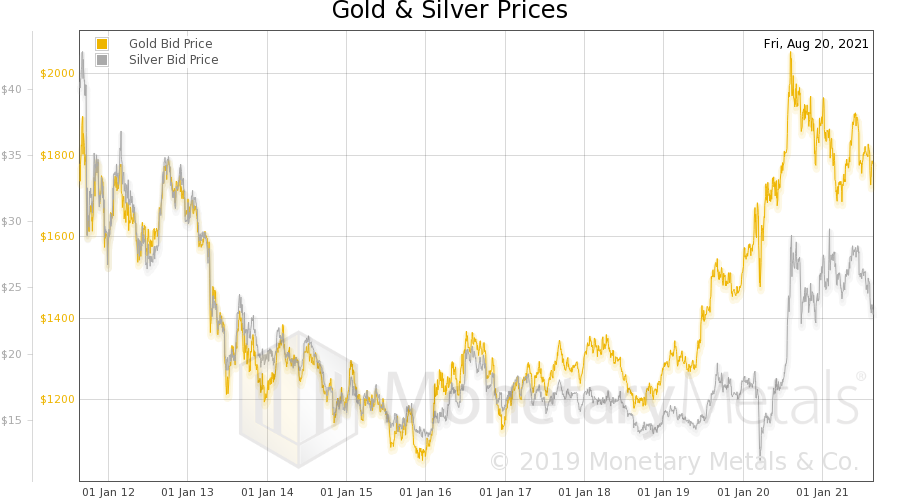
| One way to look at the price of gold, is that it dropped from its high around $1,900 in early June. Another way is to zoom out, and look at the big picture. Here is a 10-year chart of gold and silver prices.
For over four years, after the peak around $1,900 ten years ago (early September 2011), the price of gold moved down. By December 2015, it was just over $1,000. Then it was a sideways market until three years ago (August 2018), when the price was well under $1,200. It spent two years rapidly rising, to well over $2,000 a year ago (August 2020). Since then, it has been down and sideways to its current level under $1,800. The silver price has had a greater fall, and did not begin to rise until later (it was under $12 until the onset of the Covid lockdown). Its rise may have begun later, but it was much faster, well more than doubling in under a year to over $29 by early February this year. Since then, it has dropped, bounced but not quite to the same level, and then dropped further (now under $23). The question is: where does the gold price go from here? |
 . |
Where do gold and silver go from here?
We believe that something changed in March 2020. Several things. One, governments took power that they never before had (in OECD countries). The power to lock down innocent, healthy people. The magnitude of the damage to the economy cannot be overstated.
Two, governments dramatically increased their deficit spending. They had already been spending a lot more than their tax revenue. They had already been borrowing without the means or intent to repay. But in the wake of Covid, they increased their spending (while lockdown-afflicted taxpayers had less income, and hence paid less tax).
Three, the interest rate plunged. It has been in free fall for four decades, but took a dramatic leg down after Covid. The 10-year Treasury yield had been 1.8% in January, but it fell to 0.5%.
Gold Demand, Interest Rates, and Treasurys
The dollar is a debt instrument. It is ultimately the liability of the Federal Reserve, backed by the debt of the US government. Which is backed by the capacity to tax everyone who produces within the US jurisdiction. And, in the wake of Covid, production dropped while the amount of debt rose. The US government therefor lurched closer to default.
At the same time, the interest it pays to holders of this debt went down. Higher risk, less reward. And the opportunity cost to own gold—which pays no yield (other than at Monetary Metals®)—is less. One may be tempted by a Treasury paying 1.8%, but not so much at 0.5%.
The interest rate on this 10-year Treasury began to rise in August last year. It hit a peak (under the pre-Covid level) in March of this year. Since then, it has been falling again.
Many firms were obliged to borrow to stay afloat during lockdown. The higher their debt, the more they need dollar liquidity. Which is harder to get, when rates are higher. So at the same time that the marginal investor is tempted to sell gold and buy bonds to get the yield that is available once again, the marginal debtor is forced to buy dollars at any price. The price of gold in dollars is really just the inverse of the price of the dollar (in gold).
The price of gold moves inversely, not just to the interest rate. But to the spread between interest and time preference. Since the interest rate peak in 1981, we have been in a trend of falling time preference. So a falling interest rate did not, by itself, drive the price of gold higher. But now, near the zero bound, there is increasing divergence between the demand for dollars by the marginal saver and the marginal debtor. Thus gold price volatility, though generally higher rates tend to soften demand for gold and lower rates tend to drive demand for gold.
Since March, the interest rate has been falling again (and our theory predicts that the falling rates trend is still ongoing).
Silver Demand Compared to Gold Demand
Silver is, like gold, a monetary metal. It has stocks to flows measured in years (accumulated inventories divided by annual mine production) or decades. However, silver is consumed in many industries. A component of its demand comes from economic activity. Compare this to gold, whose demand is closer to the inverse of economic activity.
The stock market may be up, and GDP may be up, but far fewer people are employed now than before Covid. In real terms, the economy has contracted. Thus, silver’s underperformance relative to gold.
That said, silver is volatile. Sentiment can swing to both extremes—and extremes of sentiment can drive extremes of price that would not occur in gold. Sentiment for the white metal clearly perked up between March of last year and February of this year. And clearly faded somewhat since then.
This discussion of macroeconomics brings us to the unique data set offered by Monetary Metals, and our unique analysis. The gold and silver basis.
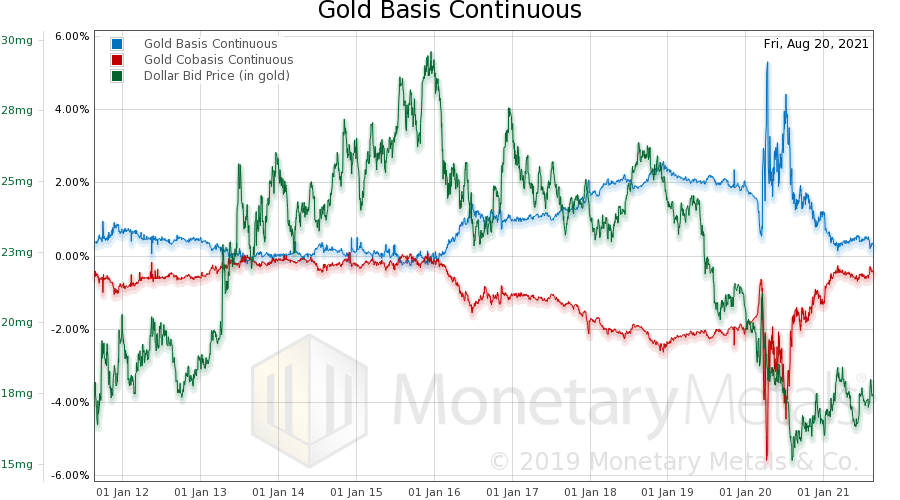
Fundamental Analysis of the Gold PriceThis chart shows the same 10-year period. But instead of the price of gold, measured in dollars, we show the price of the dollar, measured in gold. You can see the peak over 29 milligrams gold per dollar, in December 2015. At the same time, you can see the beginning of a trend of rising basis and falling cobasis (abundance and scarcity of metal to the market, respectively). In other words, at a price of 29.6mg per dollar (i.e. $1,050 per ounce), gold is pretty scarce. People are not bringing gold to the market. As the price of gold rises, it draws more gold out. As a side note, the basis will tend to be higher when interest rates are higher. This is because market makers must borrow dollars to buy gold and sell futures. This carry trade is what limits the basis spread (for a fuller discussion of this, see our Outlook 2021). We would take the basis readings between March and August 2020 with a grain of salt. Lockdown caused logistical problems that interfered with gold carry, and we believe the basis during that period is spurious and not a real signal. It is obvious that the trend of falling scarcity ended, as early as December 2018. And this trend accelerated through March of this year. Since then, basis has been sideways. But here is the thing to note. The elevated scarcity level is at just under $1,800 today. When scarcity began to rise in December 2018, the price was just over $1,200. |
 . |
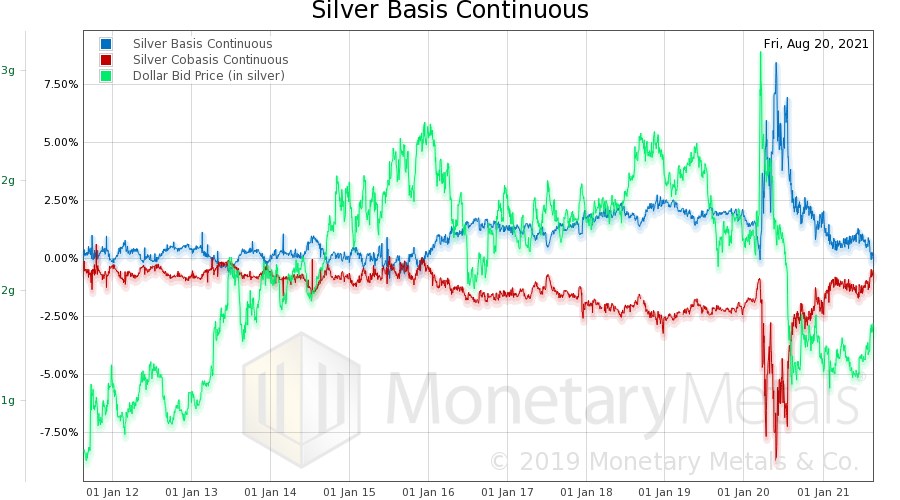
Fundamental Analysis of the Silver PriceThe same features exist in silver, as in gold. Although, we look at the right edge and think is the red cobasis line closer to crossing over the blue basis line? So let’s turn to the chart of the ratios of the gold basis to silver basis, and gold cobasis to silver cobasis. |
 . |
| Indeed, they have crossed over. The graph of just the last 150 days shows it clearer. |
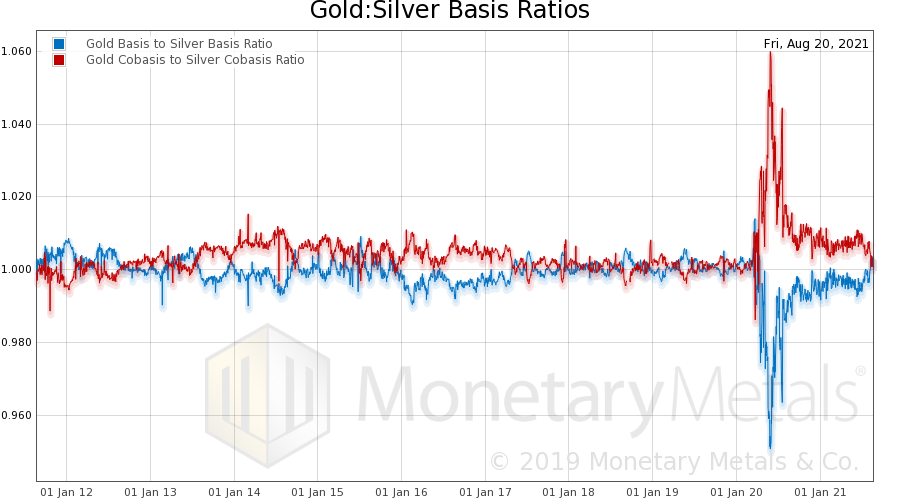 . |
| This graph is saying that the supply and demand fundamentals of silver are stronger here than they have been since the Covid crisis. |
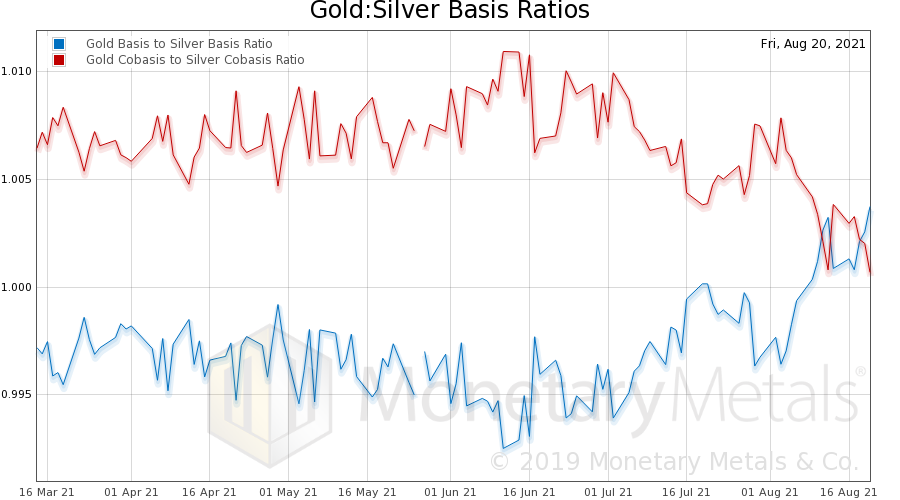 . |
This is not a predictor of timing, and it does not mean that the gold-silver ratio cannot rise further. It means that physical silver is scarcer than gold.
Monetary Metals produces research and fundamental analysis of gold and silver prices that you literally can’t find anywhere else. And it’s all free! To receive the Supply and Demand Report as soon as it is published, join our mailing list.
Monetary Metals is Hiring! For more information, click here.
Full story here Are you the author?Tags: Basic Reports,Featured,newsletter


