The Chinese were first to go down because they had been first to shut down, therefore one year further on they’ll be the first to skew all their economic results when being compared to it. These obvious base effects will, without further scrutiny, make analysis slightly more difficult. What we want to know is how the current data fits with the overall idea of recovery: is it on track, perhaps going better than thought, or falling short.
Another set of huge positives has the potential to be misleading (like the initial burst of estimates immediately following the trough had been).
China’s National Bureau of Statistics (NBS) reported late last night on the country’s Big Three economic accounts for the joint January-February period (the two months are combined because the New Year Golden Week holiday is celebrated at different times each year depending upon the Chinese calendar).
| The figures were gigantic if only given the scale of decline during the year-earlier period.
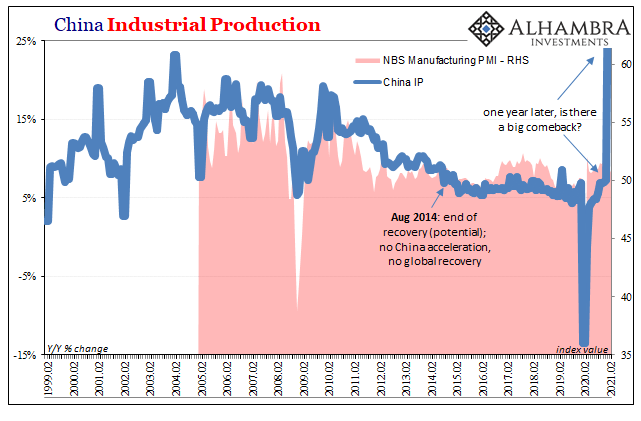
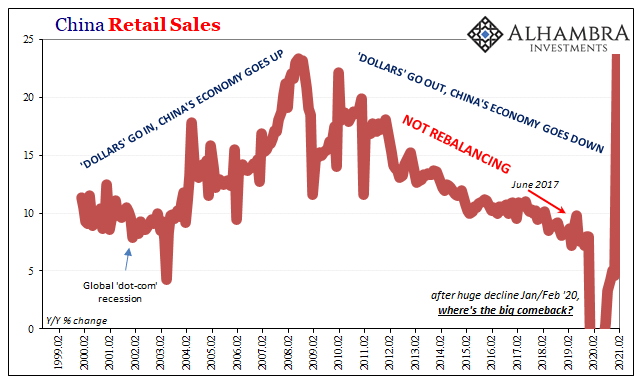
For Industrial Production, estimated output rose 35.1% year-over-year, after having fallen by 12.5% last year in the same two months. Retail Sales, the second of the three, gained 33.8% year-over-year, compared to -20.5% the year before. Likewise, total Fixed Asset Investment (FAI), the final of the trio, jumped by 35.0% in January-February 2021 compared to January-February 2020 (which had been 26.4% less than January-February 2019). What do any of these huge positives mean? Unlike most Western statistical agencies, China’s NBS doesn’t give us many other clues. In other words, unlike the US, Europe, or Japan, there aren’t any lengthy, historically-driven seasonally-adjusted data put together using consistent methodology and surveys useful in just these kinds of situations when annual comparisons can be made near meaningless; the Chinese are notorious, especially FAI, for changing the survey panel composition for reasons that are never fully disclosed, creating discontinuities along the way. To be fair, the government is attempting to move (somewhat) in the direction of more consistency and does at least nowadays provide a couple of marginally more helpful alternate formats. |
China Industrial Production, 1999-2021 |
| Beginning with IP, no, just the unadjusted data. For it, though, we are led to believe that total output in January-February 2021 was about 16.9% more than it had been during January-February 2019 (down 13.5%, then up 35.1% from that level). That works out to an 8.1% compounded annual rate, noticeably better/higher than pre-2020.
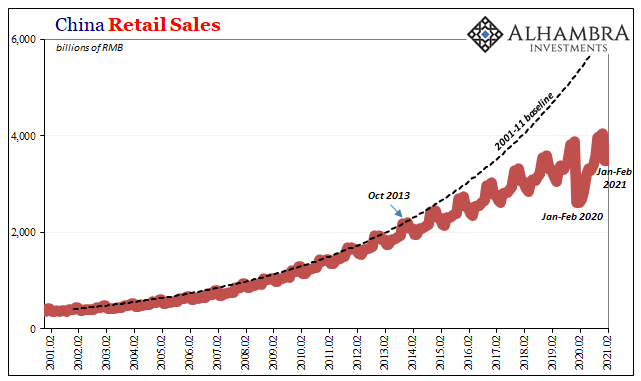
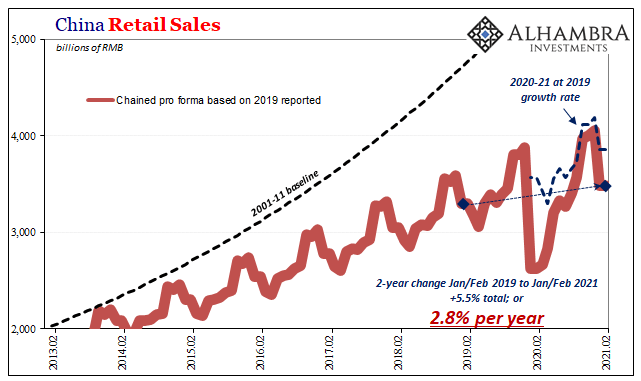
With the official (and Caixin) manufacturing PMI declining, and with much of that elevated activity being advanced by COVID-related industrial manufacturing, questions remain about whether or how much this would be sustainable. Furthermore, even at 8% it doesn’t represent a comeback of pre-2014 growth, just a slightly pickup from what had been Euro$ #4’s deeper slump. In retail sales, the NBS provides relatively continuous nominal spending estimates. According to these, China’s consumers had disbursed rmb 6.97 trillion on goods in the first two months of this year. That was up from the low shutdown level of rmb 5.25 trillion last year, but only marginally better than the rmb 6.61 trillion outlaid during January-February 2019. Thus, while retail sales were up a tremendous-sounding 33.8% from last year, total nominal spending only gained 5.5% over those two years. This works out to just 2.8% (compounded annual), indicating that, like last year’s figures, Chinese consumers remain significantly depressed (the official unemployment rate was thought to have increased to 5.5% by February from 5.2% in December), not having come back much at all from last year’s huge trough. |
China Retail Sales, 1999-2021 |
| Prior to 2020, retail sales growth rates below 8% had been largely unheard of – to the point of eight being thought of as a floor.
Now, not only did retail sales suffer huge declines in 2020, there hasn’t been any material advance out of that huge economic hole for China’s vast retail sector. These numbers for early 2021 show that, so far as internal consumption is concerned, the recovery continues to be stalled far short of recovery for now lasting an entire year. The pre-2020 eight percent “floor” was already insufficient to achieve a “rebalancing” of primary economic factors. Though China’s 14th five-year plan relies heavily on “dual circulation”, with internal consumption still figured to be the greater part of it, more evidence of serious internal impairment raises even more doubts. |
China Retail Sales, 2001-2021 |
China Retail Sales, 2013-2021 |
|
| The secret to China’s massive previous growth had always been its supply-side heavy investment (FAI). Most of the world’s attention came to be focused on a misunderstanding of purported ghost cities, much of what urbanized and transformed the Chinese economy and society, what ultimately contributed to sustained growth (derived from eurodollar sources), was sustained robust investments in infrastructure and heavy industry rather than real estate speculation in condos.
More than anything, the post-Euro$ #3 (2014) drop-off in FAI demonstrated the precarious shape of economic (and political) risks; no wonder authorities came to emphasize consumption over investment, the latter simply fell off a cliff (dollar shortages will do that) leaving them no other options. Here again, the NBS only provides a marginally helpful alternative data series to the unadjusted FAI estimates that rely on unreliable survey panels. |
China Fixed Asset Investment, 2012-2021 |
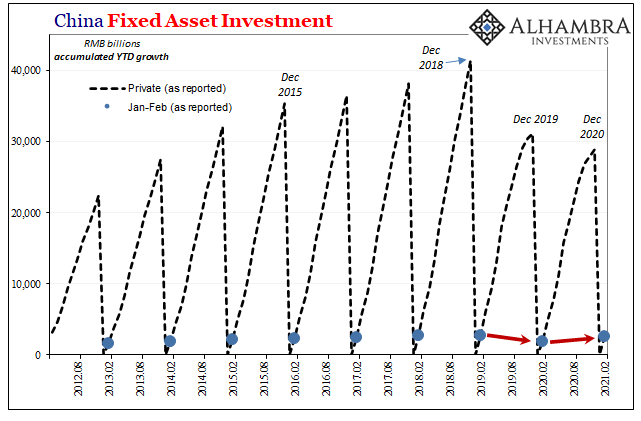
| As you can see below, authorities reclassify firms that has, over the past few years, made them ineligible (based on purported size limits) to be continuously included in the data; the reported numbers are lower one year to the next, but the NBS says apples to apples FAI has been up by small amounts.
Just how small, that’s again the question for investment beginning 2021. |
China Fixed Asset Investment, 2013-2021 |
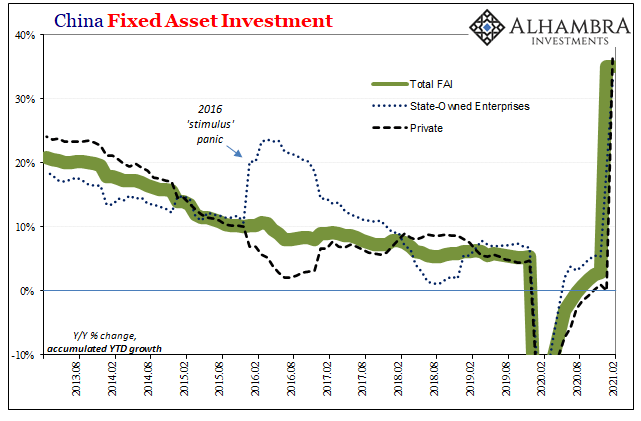
| Nominally, total investment was up 35.0% year-over-year with private FAI gaining 36.4% and public (state-owned) investment up 32.9%.
Beside these raw calculations, the NBS over the last fourteen months has disclosed a chained, seasonally-adjusted estimate of monthly changes. Putting these together and working backward to the beginning, we figure that on a purportedly consistent basis (after the latest downward revisions) total FAI in February 2021was 4.5% higher than it appeared to have been in December 2019. This works out to an annual rate of 3.9% which suggests, like retail sales, not robust where investment-led growth is concerned. In terms of state-owned FAI, the gains continued to conform to the much-publicized program where authorities refrain from overly indulgent interventions and rescues (because China’s communists realized such waste hadn’t rescued China). |
China Fixed Asset Investment, 2018-2021 |
| Base effects have made the Big Three more difficult to judge, but put altogether all three sets of data add up to what Li Keqiang has already said when announcing the “unexpectedly” low Chinese growth target of “over” 6% this year. These estimates, particularly retail sales, show why authorities aren’t expecting much more than what’s pretty bare bones even after so much time has passed, leaving the rest of the world to deal with the worst two-year period in decades from the one place the rest of the world is really counting on.
The best we can figure, these are not at all the inflationary kinds of results the global economy had been told to pin its inflationary (more completely recovery) hopes upon. |
China GDP, 1994-2021 |
| But the Chinese, anyway, already know they’re struggling; even if they, like us, aren’t exactly sure by how much. |
China Price Stability, 2007-2021 |
China Price Stability, 1996-2021 |
Full story here Are you the author? Previous post See more for Next post
Tags: China,currencies,Deflation,economy,Featured,Federal Reserve/Monetary Policy,fixed asset investment,industrial production,inflation,Markets,newsletter,Retail sales


