


Jeffrey P. Snider
My articles My offerMy siteAbout meMy videosMy books
Follow on:LinkedINTwitterSeeking Alpha
| What had given Inflation Hysteria #1 its real punch had been the benchmark 10-year Treasury note. Throughout 2017, despite the unemployment rate in the US, globally synchronized growth being declared around the world (and being declared as some momentously significant development), and whatever other tiny factors acceding to the narrative, longer-term Treasury rates just weren’t buying it. Instead, the eurodollar monetary system continued to cling to these safest, most liquid instruments through nearly the whole year.
Nearly. The 5-year UST yield started to perk up in September 2017, but it was the 10s – and when – which really drove Reflation #3’s final insanity to truly hysterical proportions. Once the Tax Cuts & Jobs Act of 2017 made it through Congress and all its pitfalls and political stunts, this “massive” act of dollar “destroying” “stimulus” finally moved the longer-dated Treasury market off its inflation-defying spots. Nominal yields rose and did so, for a short time, rather quickly. |
UST Yield Curve, 2017-2018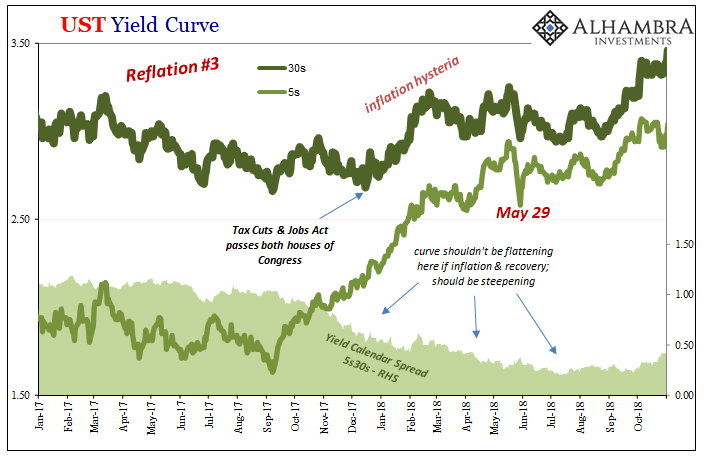 - Click to enlarge |
| There’s always an important distinction between the 5s and the 10s; temporary or transitory influences can bake and fake the inner stuff, including what the Federal Reserve does under its own mistaken assumptions (such as “rate hikes”). Outside the belly, into the 7s on into the benchmark 10s and beyond, that’s much more about how this key market views the consequences for what’s going on in the current situation.
Probability spectrums for what happens down the road given underlying fundamentals and any perceived changes in them. Thus, outwardly it seemed like TCJA really had been the game-changer everyone was saying it would be. Finally! The 10s joined the inflationary fire! Except, no. Like inflation expectations in TIPS or swap spreads discussed earlier, what really had happened was a very modest, ultimately temporary shift in recognized overall probabilities. Maybe the TCJA could have some effect, but by and large the market (nominal, UST, swaps, eurodollar futures, etc.) wasn’t at all radically discounting the deflationary baseline in effect since August 2007. |
UST Yield Curve, 2003-2020 - Click to enlarge |
| Consistent with that age, however, this molehill of a tiny selloff was transformed into the catalytic mountain for Inflation Hysteria #1. Interest rates had nowhere to go but up, up, and away, they all confidently declared, especially as the benchmark 10-year yield reached its own highest-in-years levels.
Even on its own nominal terms, though, the yield curve shape was denying this narrative interpretation. The flattening curve represented serious and growing skepticism; which, ultimately, proved to be the correct call. As nominal yields gained during the balance of 2018, this flattening (and already-inverted eurodollar futures) was indicating growing probabilities of another deflationary – rather than the first inflationary – outbreak. The bond market never once really shifted off its underlying mantra: the global economy always more likely to sour than soar. In late 2017, that was still the case in the bond market, if only slightly less potentially sour and a tiny bit more toward soar. Nowhere near some categorical change in outlook. |
UST Yield Curve, 2020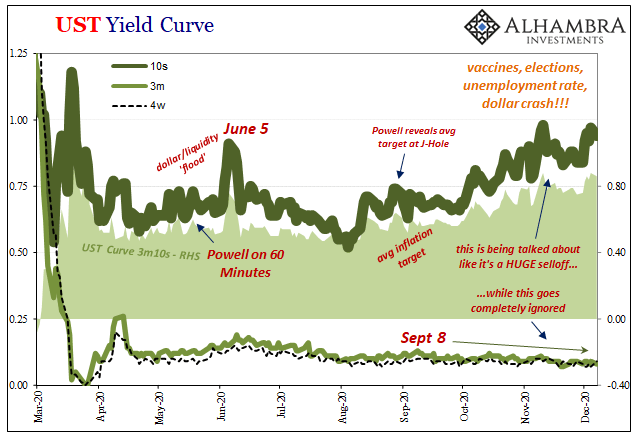 - Click to enlarge |
| And now, here we are all over again. Only this time the 2017 TCJA molehill is a mountain compared to the vaccine-dollar-crash-whatever-they’ll-call-CARES-ACT-II barely visible lump.
Yep, Treasury yields are a little higher than they were more recently. It still doesn’t come close to projecting inflationary fire and the dollar’s devastating collapse. Far from it, there’s an order of magnitude more sour today than even the most hysterical points of 2017-18. Just like 2017, even easier than 2017, it’s not all that difficult to figure out why. |
Pro forma CES Private Payrolls, 2020-2021 - Click to enlarge |
Full story here Are you the author?
Tags: Bonds,currencies,dollar,economy,Featured,Federal Reserve/Monetary Policy,inflation,Markets,newsletter,U.S. Treasuries


