


George Dorgan
My articles My siteAbout meMy videosMy books
Follow on:LinkedINTwitterSeeking Alpha
CFA SocietyEconomicBlogs
We do not like Purchasing Power or Real Effective Exchange Rate (REER) as measurement for currencies. For us, the trade balance decides if a currency is overvalued. Only the trade balance can express productivity gains, while the REER assumes constant productivity in comparison to trade partners.
Who has read Michael Pettis, knows that a rising trade surplus may also be caused by a higher savings rate while the trade partners decided to spend more. This is partially true. Recently Europeans started to increase their savings rate, while Americans reduced it. This has led to a rising trade and current surplus for the Europeans. But also to a massive Swiss trade surplus with the United States, that lifted Switzerland on the U.S. currency manipulation watch list.
To control the trade balance against this “savings effect”, economists may look at imports. When imports are rising at the same pace as GDP or consumption, then there is no such “savings effect”.
After the record trade surpluses, the Swiss economy may have turned around: consumption and imports are finally rising more than in 2015 and early 2016. In March the trade surplus got bigger again, still shy of the records in 2016.
Swiss National Bank wants to keep non-profitable sectors alive
Swiss exports are moving more and more toward higher value sectors: away from watches, jewelry and manufacturing towards chemicals and pharmaceuticals. With currency interventions, the SNB is trying to keep sectors alive, that would not survive without interventions.
At the same time, importers keep the currency gains of imported goods and return little to the consumer. This tendency is accentuated by the SNB, that makes the franc weaker.
Texts and Charts from the Swiss customs data release (translated from French).
| After its historic decline in the second quarter, Swiss foreign trade showed a clear recovery in the third quarter of 2020. In seasonally adjusted terms, exports swelled by 6.5% and imports by 11.5%. The two traffic departments, however, remained well below their record level for the second quarter of 2019. The trade balance closed with a surplus of 8.2 billion francs. In short:▲ Exports: watches and jewelry up by more than 3 billion francs ▲ Record exports to China ▲ Passenger car imports are on the rise |
Swiss exports and imports, seasonally adjusted (in bn CHF), Q3 2020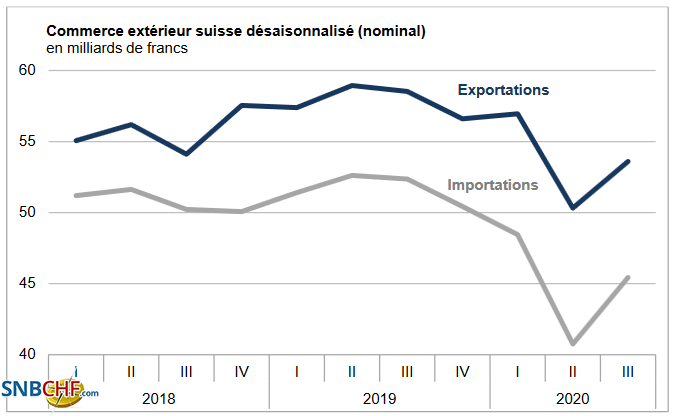 Source: newsd.admin.ch - Click to enlarge |
Global evolutionAfter their historic setback in the 2nd quarter of 2020 (-11.6% or -6.6 billion francs), seasonally adjusted exports posted growth of 6.5% in the third quarter to 53.6 billion francs (actual: +9, 9%), i.e. a level comparable to that recorded three years earlier. On a monthly basis, they increased in July and August 2020 to weaken by 1.9% in September (actual: -2.1%). Following their decline in the previous two quarters, imports jumped 11.5% in the third quarter (actual: + 9.0%) to stand at 45.4 billion francs. However, they remained 7.2 billion francs below their record level. The surplus of the trade balance reached 8.2 billion francs. |
Switzerland Trade Balance, September 2020(see more posts on Switzerland Trade Balance, )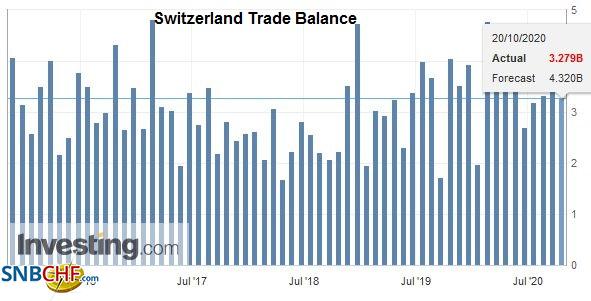 Source: investing.com - Click to enlarge |
| Exports: One sixth increase in exports to Asia and North America
With the exception of chemical and pharmaceutical products (-4.0% or -1.2 billion francs), all sectors saw their exports increase in the third quarter of 2020. Particularly affected during the previous quarter, watchmaking and jewelry and jewelry were the most dynamic (respectively +1.9 and +1.3 billion francs). Despite this regain of shape, their turnover remained well below their “pre-coronavirus” level. Precision instruments (+674 million) as well as the machinery and electronics sector (+568 million) also recovered. In chemistry and pharma, sales of active ingredients (-586 million) as well as immunological products (-559 million), on the other hand, plunged. Swiss exports gained ground to the three main markets. Asia was the most dynamic (+ 16.9% or +1.7 billion francs). Here, China, Hong Kong and the United Arab Emirates have had the wind in their sails, with a cumulative increase of 1.1 billion francs. Exports to China also set a new high at 3.9 billion francs. Sales to North America increased by 14.3%; those in the USA grew by 1.2 billion to exceed 10 billion francs. Exports to Europe are up 7.4% compared to the previous quarter. Italy, the United Kingdom, France and the Netherlands were dynamic, with the latter even posting record quarterly results. This quartet generated an increase of more than 1.8 billion francs. Germany and Spain, for their part, declined slightly. |
Swiss Exports per Sector Q3 2020 vs. 2019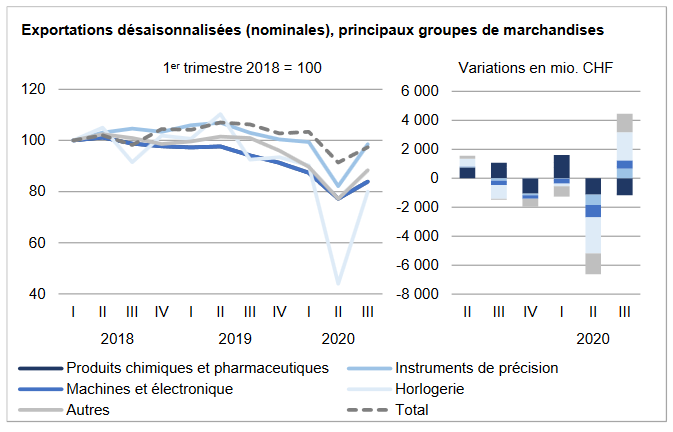 - Click to enlarge |
| Imports: After the rain, the good weather: +1.4 billion francs for imports from Germany
Import growth in the third quarter of 2020 (+ CHF4.7 billion) was based on all groups of goods. The strongest contribution carried the claw of the vehicle sector, up by almost 2 billion francs (passenger cars: +1.1 billion francs) after its woes of the previous quarter. Imports of jewelry and jewelry (other goods group) swelled from 800 million to 1.5 billion francs; however, they evolved at a level 60% lower than in Q1 2020. Chemicals and pharmaceuticals (+430 million), the machinery and electronics sector (+346 million) as well as metals (+268 million) were also progressed. Imports from Asia stagnated (+ 0.4%) while those from North America (+ 16.9%; USA: +425 million francs) and Europe (+ 13.8%) posted double-digit growth. On the Old Continent, deliveries from Germany were on the rise (+1.4 billion), followed by those from France and Italy, which recorded a cumulative increase of almost 1 billion francs. Ireland grew by a third or 320 million francs. On the Asian side, arrivals from Viet Nam increased by 473 million francs (used articles in precious metals) while those from China and Singapore fell by 310 and 118 million francs respectively. |
Swiss Imports per Sector Q3 2020 vs. 2019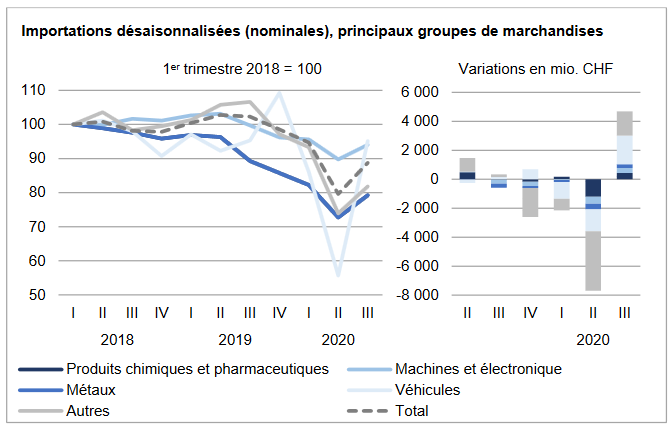 Source: newsd.admin.ch - Click to enlarge |
Tags: Featured,newsletter,Switzerland Exports,Switzerland Exports by Sector,Switzerland Imports,Switzerland Imports by Sector,Switzerland Trade Balance


