


George Dorgan
My articles My siteAbout meMy videosMy books
Follow on:LinkedINTwitterSeeking Alpha
CFA SocietyEconomicBlogs
After the strong revaluation of the Swiss franc in recent years, some economists, like the ones at the Swiss National Bank (SNB), claim that the franc were overvalued. Finally this claim is propaganda, because it is based on a not usable models (the REER and purchasing power parity) and wrong assumptions.
The mistakes
- Many use misleading Purchasing Power Parity (PPP) measures like the Big Mac index, the OECD index or the PPP based on consumer prices for fair values.
- The second big mistake is to compute the Real Effective Exchange Rate (REER) with the wrong “base year”, i.e. to assume that in 1999 the CHF was correctly valued.
- The third error is to assume that the Euro zone will return to high GDP growth. High GDP growth – for example in Italy – was enabled by a massive reduction of the household savings rate from 20% of income in 1992 to 4% in 2007. During the same time, the Swiss household savings rate remained stable around 13%. The savings situation is even worse in Greece with a negative savings rate and near zero in Spain. With the aging effects, one can expect that the savings rates for countries like Italy goes up again and reduces GDP growth.
- The fourth mistake is to ignore massive Swiss trade and current account surpluses, helped by high savings and by immigration of cheaper highly qualified personnel. Both help to reduce unit labor costs and achieve productivity gains. Eventually the ex-post FX evaluation based on current account and capital flows in the balance of payments should clearly take precedence against the ex-ante FX evaluations REER and PPP, that are obviously misleading for the franc.
- The fifth error – and related to the fourth one – is it to ignore the improving Swiss terms of trades thanks to cheaper energy prices. In particular the chemical industry, companies like Ciba, Clariant, Givaudan, Roche and Novartis take advantage.
- The sixth misunderstanding is to think that Swiss companies mostly export into the euro area. Nearly 40% of exports go into the rest of the world, most importantly the dollar area, that also contains China – thanks the “near peg” of the yuan to the dollar. But dollar and yuan revalued far more than the franc!
Hence, the claim that the Swiss franc were overvalued, are simply propaganda, with the aim to rip off retail FX traders once again.
Further down this page, readers can see the original page from 2012,
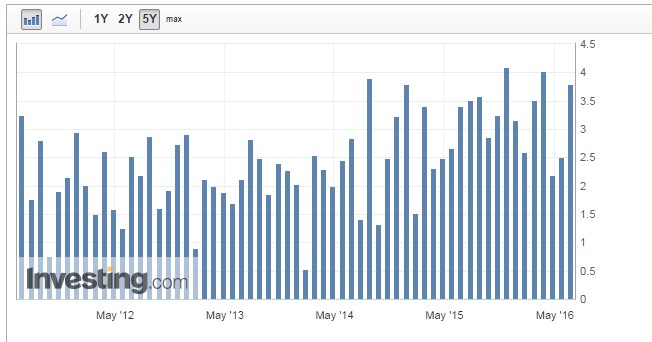
Update June 2016: Trade Balance is the most important factorEventually it is the trade balance that decides if a currency is overvalued. Despite (or BECAUSE of) all FX Interventions, the Swiss trade surplus is still too high. There are two major reasons for the trade surplus:
But Germany has already overtaken Switzerland in terms of trade surplus in % of GDP. Over the long-term the Swiss trade surplus must adjust towards zero, while the currency must appreciate. The consequence of the stronger currency is a higher purchasing power which leads to more spending and finally more imports. The Swiss Savings Rate must fallIn recent years this has not happened yet, because the Swiss have increased their savings rate, while the Swiss National Bank prevented big parts of the necessary currency adjustment. A reduction of the savings rate with an ageing society is a second possibility for a reduction of the trade surplus. Spendings of an ageing population was the main reason why the strong Japanese surplus of the 1990s finally fell under zero in 2012. However the high immigration rates and positive natural change leads to a quickly increasing Swiss population. The Swiss is not the Japanese case! The Swiss franc has by far not finished to appreciate.
|
The Swiss Trade Surplus remains too high for a weaker franc
The Swiss Savings Rate has risen in recent years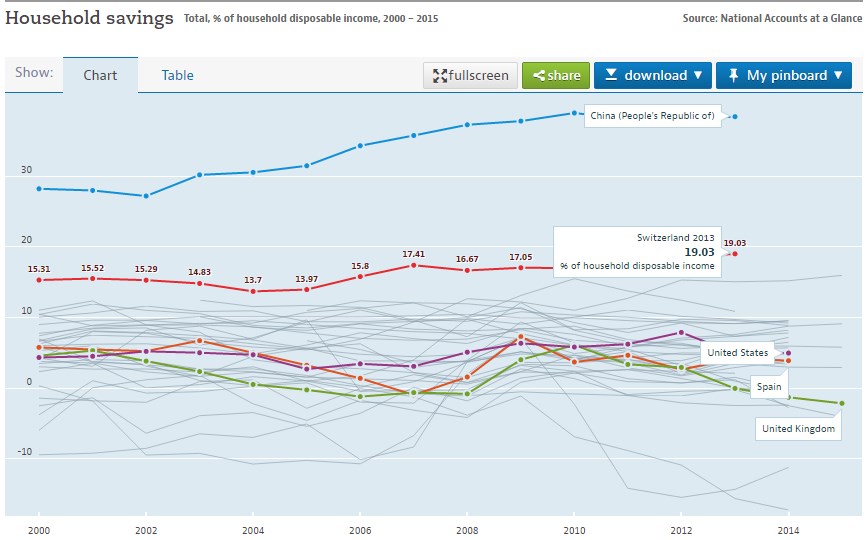 click to enlarge, source OECD
|
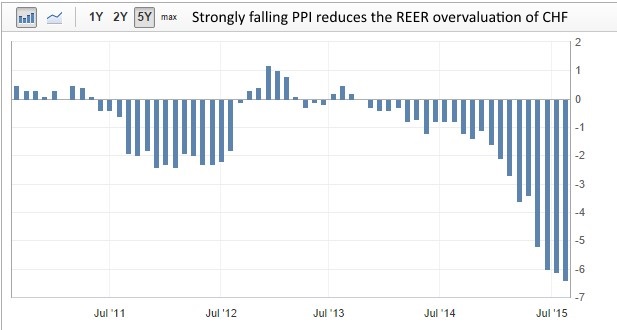
UPDATE August 2015:The value of minus 6.4% for the Swiss PPI change on a yearly basis, implies that the overvaluation of the Swiss Franc, even for the misleading measurement REER, has been strongly reduced. With the end of the peg, the nominal exchange rate has risen by 10% against the euro, but the real rate against the euro has changed only by 5%. The value is far lower than the minus 1.3% for Germany, the major Swiss trading partner, or minus 2.1% for the Euro Zone. Production price differences have become smaller and help to reduce disadvantages of Swiss firms. The strong falling of Swiss PPI was mostly caused by the strong revaluation of CHF and cheaper oil prices. This resulted in 10% lower import prices. Swiss exporters were obliged to cut prices for their quality goods by only 5.2%, hence they achieved huge margin gains (link to the PPI report on Swiss Statistics). Expensive Swiss labor costs apparently played a small role, and a reason for this might be that a big part of the value chain is already outside of Switzerland. |
 |
The self-fulfilling FX prophecyWe call this reduction of overvalution the “self-fulfilling FX prophecy” for a currency with strong trade surpluses, a slow rise of labour costs and a global value chain.
Hence when the SNB says: Now we accept EUR/CHF 1.05, then the fair value will sooner or later be at 1.05, too, or it is already today. Business cycles may prevent the timely adoption of fair values. In particular the business cycle that increased American and Southern European debt until 2007 had prolonged the adoption of the fair value for the franc. Instead the Swiss increased their wealth and savings and implicitly the value of Swiss franc in the long-term view, simply because all borrowed money had to be paid back.
|
The direct impact of this self-fulfilling prophecy is an implicit real yield of 6.1% on CHF cash investments, which is effectively SNB debt. These 6% are clearly higher than the yield the SNB may achieve on bonds or equities. Our evaluation gives a 1.26% yield on SNB investments for 2012 or 1.81% in 2011.
On average, this 6% yield on CHF cash investments (aka SNB debt) occured every year since 2007 – since the EUR/CHF was at 1.60. Should this tendency continue for another 5 to 7 years, then it will lead to the bankruptcy of the central bank or at least negative equity. The self-full-filling FX effect can only be disabled by a longer-lasting carry trade against CHF, but this carry trade requires sufficiently higher interest rates in the U.S. or in Europe. Moreover, one should remember that all carry trades collapse one day, for example on January 15th. |
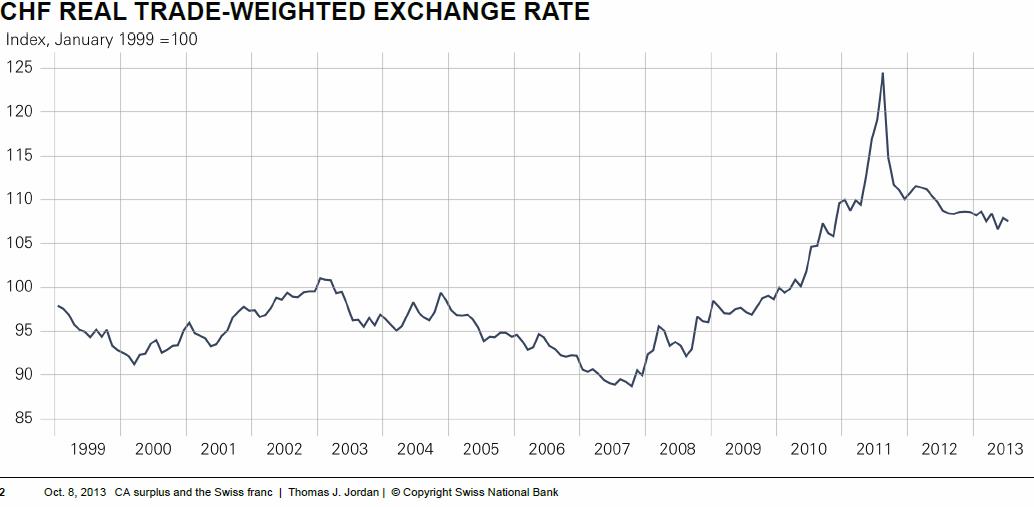
UPDATE early 2014:The SNB recently published the latest real effective exchange rate (REER). According to this the franc was only 7.5% overvalued against the base year 1999. |
 |
Questions that remain open are:
|
The Swiss Franc was weak in 1999, in the REER base year
|
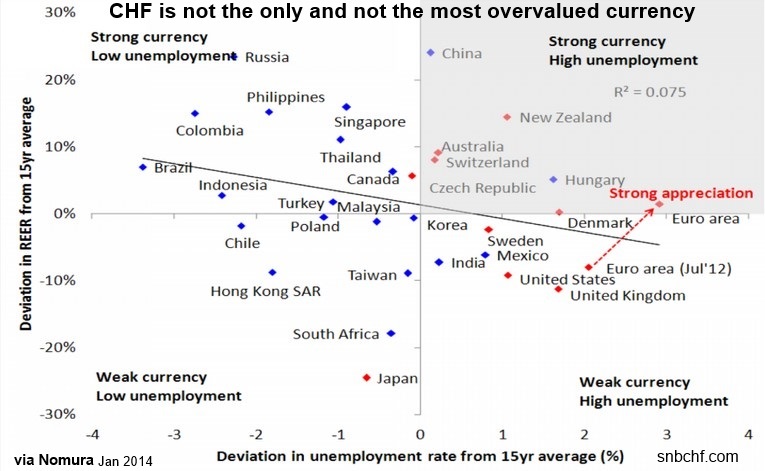
Nomura (2014): CHF not the most overvalued currencyNomura’s Jens Nordvig shows that CHF is not the only one and not the most overvalued currency. Unfortunately Nordvig uses again the 15 year time span until 1999, that we criticized before. |
 |
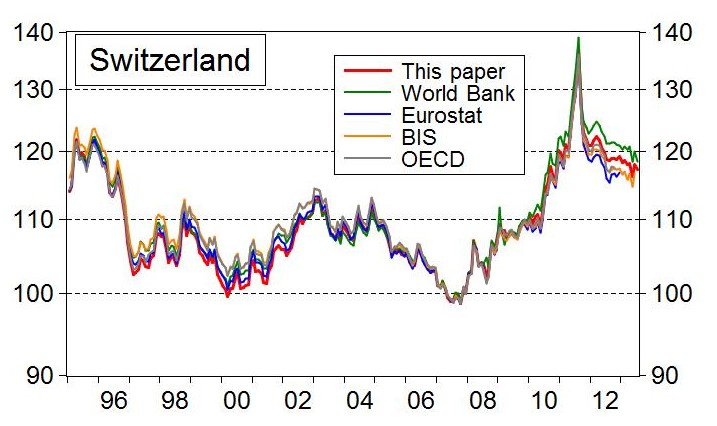
Bruegel ThinkTank (2014)The blog of the Bruegel ThinkTank is helpful and provides the chart based on Bank of international Settlements (BIS) (CPI-based), World Bank, Eurostat and OECD. We still have to verify the terminology of the others, but we assume that they are all CPI-based.
This shows that currently the franc is fairly valued against 1995. The concatenation factor (CPI or PPI) is very important because PPI reflects tradables better while the CPI mostly speaks about non-tradable goods and services (e.g. apartment rent, locally produced and consumed food). |
 |
————————————————————————————————————————————————————————————————————————–
Purchasing Power Parity and REER: Is CHF Overvalued?
(Post originally published in 2012, concept still valid, recent data updates are above)
Purchasing Power Parity and real effective exchange rates (REER) can be measured in different terms.
We explain why the PPP based on producer price indices (PPP-PPI) or on export prices are the most relevant ones. It is shown that the commodity currencies, AUD, NZD and NOK, are overvalued but the Swiss franc is not. The Bloomberg PPP-PPI indicates that the franc is undervalued against the euro, while the PPP-PPI from the Swiss KOF institute indicates that it is slightly overvalued.
This suggests that the so-called “minimum exchange rate” of the EUR/CHF could be a fair value and not a “minimum”.
We want to examine in this research if the Swiss franc is really overvalued. We recapitulate a big part of the foreign exchange theory concerning purchasing power parities.
Ideally you have read our chapter on purchasing power theory and have understood the concepts:
- The basis: Law of one price
- The “Penn Effect” effect and the importance of Tradable Goods
- The Balassa–Samuelson effect
- Absolute purchasing power parity measures
- Why the Big Mac and Starbucks Tall Latte index can be ignored
- Why the absolute PPP via OECD has low significance.
- Differences in CPI baskets and their influence on the PPP
- Relative purchasing power parity measures
- Relative measures compare prices changes for different countries between today and a base year.
- Differences between PPP based on producer and consumer prices are very important, in particular for Switzerland
The most relevant PPP is one based on the producer price index (PPI) and therefore mostly based on tradable goods, abbreviated PPP-PPI.
PPP for CHF based on producer prices
The deflator for purchasing power parity and REER is most often an index based on producer prices. These products, however, are usually a sales-based combination of products sold to the local and to foreign markets.
Pictet’s REER long-term graph suggests a 0.4% trend per year. It is based on the 1975 value.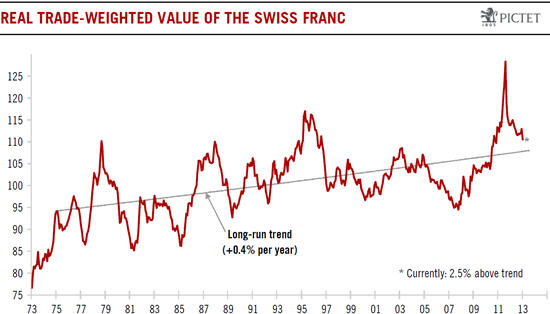
The PPP for EUR/CHF provided by UBS stood in June 2013 around 1.32.
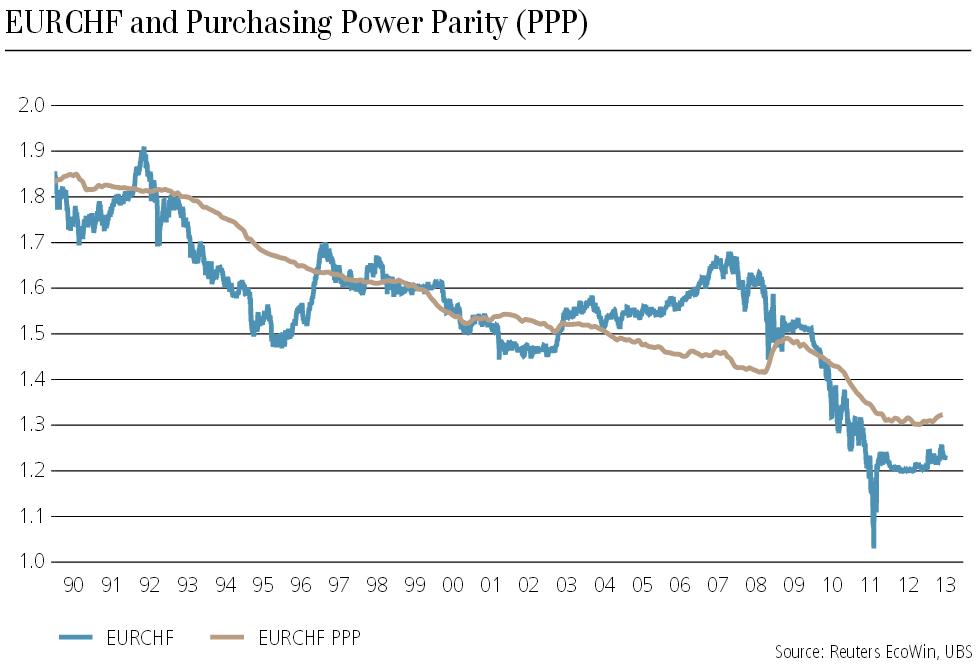 (source UBS)
Due to the European inflation, the PPP fell by November 2012 to around 1.30. UBS’s PPP has 1990 as base year. It decreases each year in which Swiss PPI is lower than European PPI.
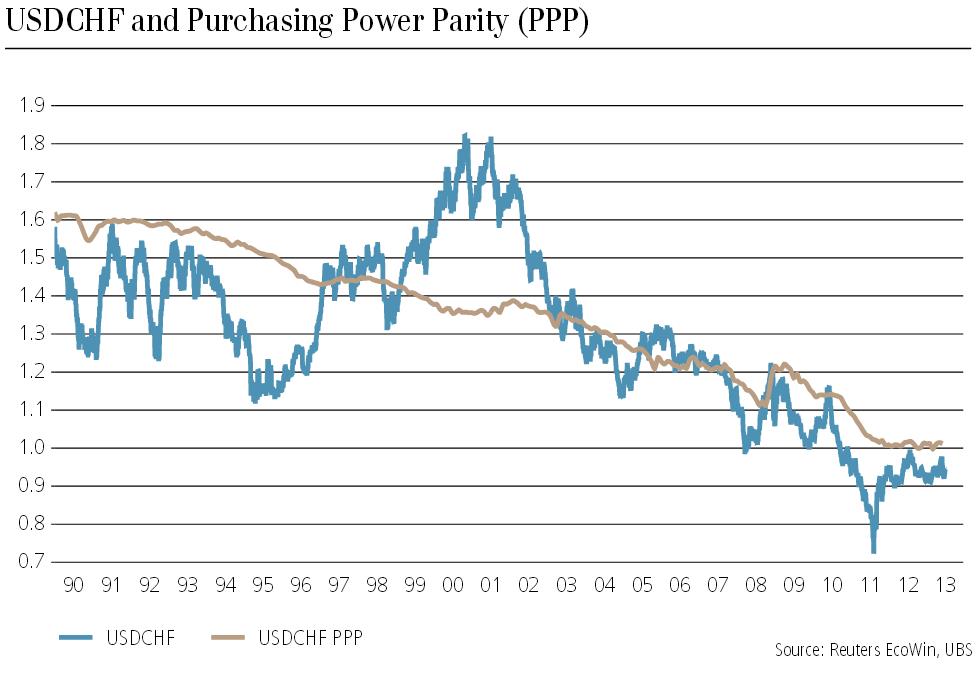
According to UBS’s PPP-PPI the US dollar would be “fairly” valued around 1.01 against the franc.
The one from HSBC-Trinkaus is also based on PPI.
For them, the AUD, NZD and NOK were strongly overvalued against the euro in September 2012, but the franc was near fair value. For them the dollar and the yen were fairly valued, because they were inside their lower/upper limit range.
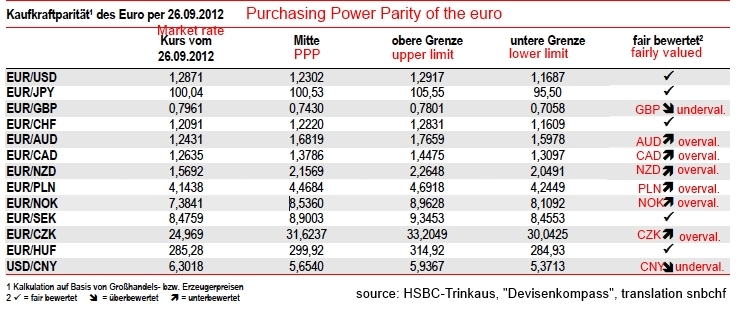
With the Chinese slowing, the reality has followed HSBC’s anticipation and AUD, NZD and NOK have depreciated until August 2013.
The Bloomberg PPP is based on the producer price indices (PPI).
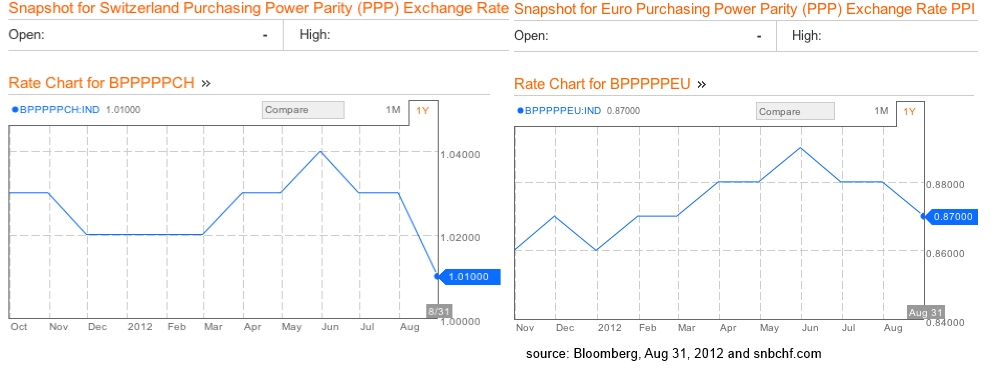
In August 2012, USD/CHF Bloomberg PPP stood at 1.01, but the one for USD/EUR is at 0.87 (inverted notation). This implies a PPP for EUR/CHF of 1.16, meaning that the Swiss franc is undervalued against the euro.
The Bloomberg evaluation has been based on producer price inflation since the year 2000. The base is the average exchange rate between 1982 and 2000. Since the dollar was relatively strong between 1982 and 2000, the correct USD/EUR PPP might be a bit lower.
For the EUR/CHF pair things are different, it mostly followed the trend line of the trade-weighted currency rate. Therefore it is difficult to doubt the accurateness of the Bloomberg fair value of 1.16 for the EUR/CHF.
This implies that Swiss producers have been and are competitive enough, not least thanks to a low tax level, cheap import prices and a continuing immigration of qualified labor. The strong current account is only one symptom of this competitiveness.
PPP based on Input Producer Prices vs. PPP based Output Producer Prices
Statistics bureaus in certain countries like the UK are able to provide a differentiation between input and output price indices (PPI). The input PPI include costs of prime materials, capital and labor. The most recent UK data showed that the YoY input PPI fell by 1.2%, but the output PPI (for home sales) rose by 2.5%. The stronger sterling and cheaper energy prices helped to improve margins of British companies.
Unfortunately, the Swiss Statistics Bureau does not provide producer price indices based on input prices. It is clear that during the strong revaluation of the franc, the Swiss producers took profit of cheaper imports in their supply chain and therefore of smaller production costs. Still the bureau distinguishes between production prices for home sales and export prices. The latest data shows that Swiss exporters do not have an issue to obtaining their desired prices. Thanks to the stronger dollar, export prices have even increased since September.

Export Prices Switzerland 2001-2012 - Click to enlarge
PPP and REER based on Export Prices of tradable goods, the best measure?
 The New York Fed explains in this paper that the PPI is not good enough. But only an export price weighted index correctly represents tradable goods, the most important factor for currencies. The PPI also includes industrial products sold on the local market, but should only contain products sold for export.
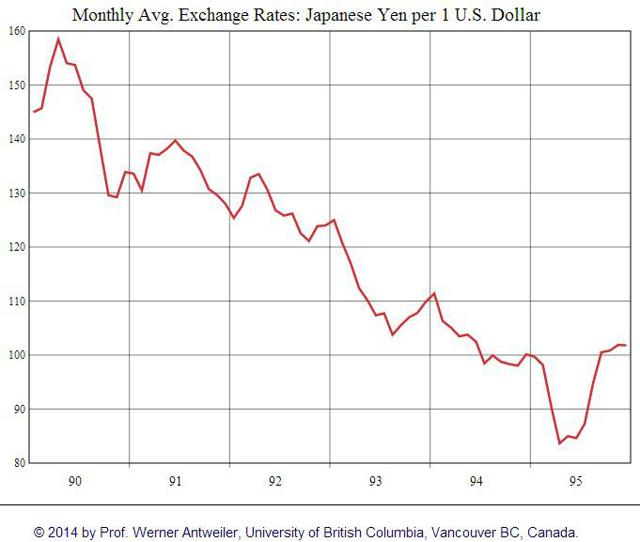
This explains why the yen achieved a strong performance between 1990 and 1995 despite the bust of the Japanese economy.
Summary
After the strong revaluation of the Swiss franc in recent years, some economists, like the ones at the Swiss National Bank (SNB), claim that the franc is overvalued. Many use misleading Purchasing Power Parity (PPP) measures like the Big Mac index, the OECD index or the PPP based on consumer prices for computing fair values. The second big mistake is to use the wrong base year and to assume, for example, that in 1999 the CHF was correctly valued. The third mistake is to ignore massive Swiss current account surpluses helped by immigration of highly qualified personnel. This last factor implies that an evaluation of the balance of payments should take preference against the REER and PPP.
The following graph from 2012 gives a comparison of the different PPP measures for the EUR/CHF rate on the base year 2000 (and previously DEM/CHF, which is actually quite misleading).
- Exchange rate (CHF/EUR), red
- Relative Producer Prices (PPP based on PPI, not distinguished between exports and local consumption), black
- Purchasing Power Parity (PPP according to OECD), blue
- Relative GDP deflator, orange
- Relative Consumer Prices (PPP based on CPI), dark green
- Relative unit labor costs (ULC of the OECD), brown

Different Measures PPP in Comparison KOF - Click to enlarge
It shows that the PPP-PPI calculated by the KOF is only slightly higher than the current EUR/CHF exchange rate.
Improvements of the KOF analysis
The KOF should have provided instead of the relative producer prices also the relative export prices. This would have given even more hints if the franc is overvalued or not. The second shortcoming is that they compare the period before 2000 with the German mark, but not with a composite of the euro countries PPIs.


