


Jeffrey P. Snider
My articles My offerMy siteAbout meMy videosMy books
Follow on:LinkedINTwitterSeeking Alpha
|
There’s already doubt given how the two major series supposedly measuring the same thing seemingly can’t agree. If the rebound was truly robust, it would show up unambiguously everywhere. But IHS Markit’s purchasing managers indices struggled to get back above 50 in July, barely getting there, suggesting the economy might be slowing or even stalling way too close to the bottom. The Markit manufacturing index was revised lower than the flash estimate, down to just 50.9 last month. The services stat was given an additional 0.4 points to finish the month right at 50 (the composite therefore 50.3). The way the Institute for Supply Management (ISM) versions are being reported, however, these other must be describing an entirely different set of circumstances. In the manufacturing sector, this one pushed up to 54.2 which was the highest since March 2019. Over in non-manufacturing, another jump in July all the way up to 58.1. |
Europe ISM Manufacturing PMI, Jan 2006 - Jul 2020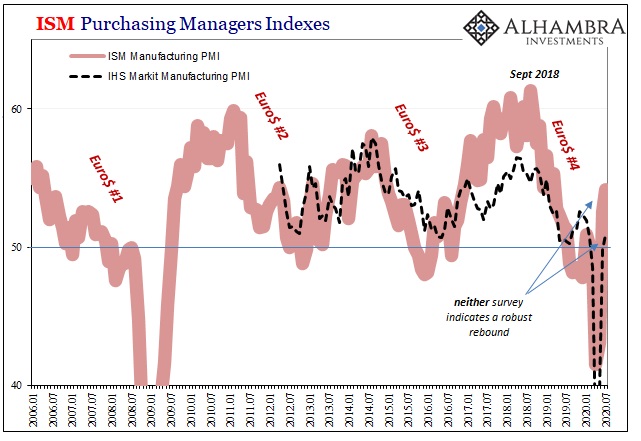 - Click to enlarge |
| In truth, neither set of PMI’s suggests a vigorous rebound. Quite the contrary, even for both of the ISM’s, for them to be back even only to the same level of March or February 2019 isn’t exactly a reassuring outcome. Does anyone remember the winter of 2019? |
Euro ISM PMI, Jan 2008 - Jul 2020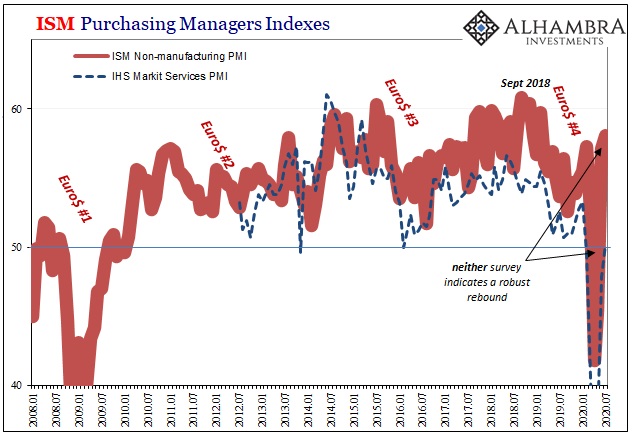 - Click to enlarge |
| If that wasn’t bad enough, following the scale and depth of contraction the US economy is trying to find its way out from, these PMI’s should be (actually) skyrocketing and quickly. As I’ve shown before, all these purchasing manager indices tell you is how many of their survey respondents are reporting more or less growth and activity. |
PMIs US Comp Hypothetical, Jan 2018 - Aug 2020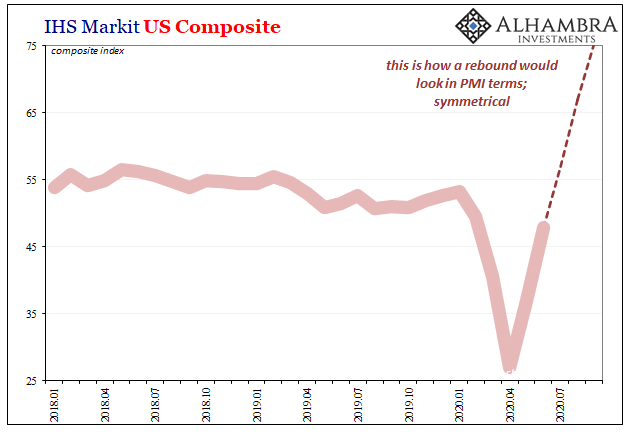 - Click to enlarge |
| At 58.1, let alone the three others well below it, that’s not nearly enough coming in on the “more” activity side. After you fall (or get pushed) into a large hole, rocketing out of it would necessarily require the balance of reportings to lean entirely on the other end of the scale; for a PMI, it should mean as high a number above 50 as it had been below all the way down at the bottom.
Even sticking to just the “good” ISM estimates, the one key subcomponent within them backs up what I’m writing. Everything comes down to employment; from the very beginning, it was always about getting everyone back to work as fast as humanly possible. |
Europe ISM Manufacturing Employment, Jan 2006 - Jul 2020 - Click to enlarge |
| The whole ballgame rests upon that one thing.
If the mainstream interpretation of these particular PMI’s picturing a robust V-shape recovery was valid, then businesses would be adding back workers at close to the same awesomely positive rate as its headline surges up toward the upper 60s on the way well into the 70s. Instead, in both ISM series each employment subindex remained fixed well below 50 – for July. |
Europe ISM Non-Manufacturing Employment, Jan 2017 - Jul 2020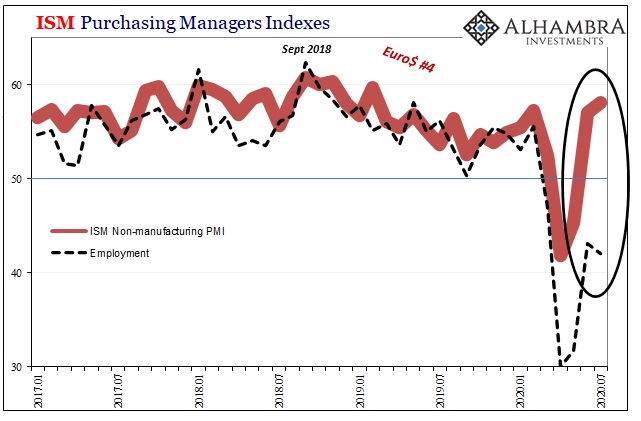 - Click to enlarge |
| This is no discrepancy, either, since what each indicates is how, again, the rebound really isn’t much of one. An upturn off a deep trough isn’t necessarily the same thing as a recovery, positive numbers are subject to gradation. The data shown above indicates that in both ISM sectors, manufacturing and services, businesses are reporting that though things are moving back positive again, low standard, quite a few more of them remain more likely to be laying off than hiring back.Why? Because slowly getting better after an enormous dislocation isn’t exactly inspiring; in fact, this would be downright alarming given where we started the process. |
PCE Income Jobless Initial Claims, Mar 2017 - Jun 2020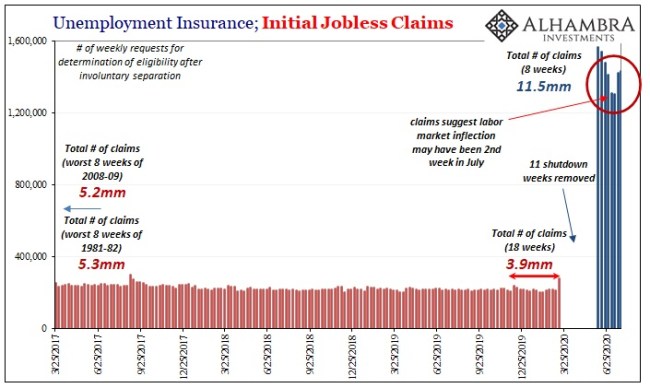 - Click to enlarge |
| And that’s really what both sets of PMI’s have indicated, and are continuing to indicate. The economy hit bottom back in April, maybe early May, and it has turned around. A necessary but far from sufficient condition for recovery; especially given that what’s followed isn’t even close to how it’s been described in the mainstream view.
After three months of reopening, the better of the two series can’t even best early 2019 (the lessening proportion of survey respondents reporting more activity) when growth was scratching toward the recession “scare” of last summer. Therefore, even these “best” results are really confirming jobless claims. |
TIPS Yields and Breaks, Jul 2008 - 2020 - Click to enlarge |
Full story here Are you the author?
Tags: Bonds,currencies,economy,employment,Featured,Federal Reserve/Monetary Policy,ihs markit manufacturing pmi,ism manufacturing index,ism non manufacturing index,jobless claims,Labor Market,Markets,newsletter,PMI


