


Lance Roberts
My articles My offerMy siteAbout meMy videosMy books
Follow on:TwitterSeeking AlphaFacebookAmazon
|
Why this isn’t 1920 has everything to starting valuations and future returns. While, generally, I’m not too fond of comparisons between today’s markets and the past, Ed Yardeni made a comparison too bombastic to disregard in his blog:
The 2020s may already be seeing a melt-up, begun on March 23.” Ed’s point was the economic and industrial revolution that occurred following WWI is a precedent for the next decade. The urbanization of populations moving from farms to cities, the rise of manufacturing and technological innovations from Henry Ford and the Model T, to the “bulldozer,” to refrigeration and not to mention the radio. |
SP500 Total Real Return, 1905 - 2019(see more posts on S&P 500, )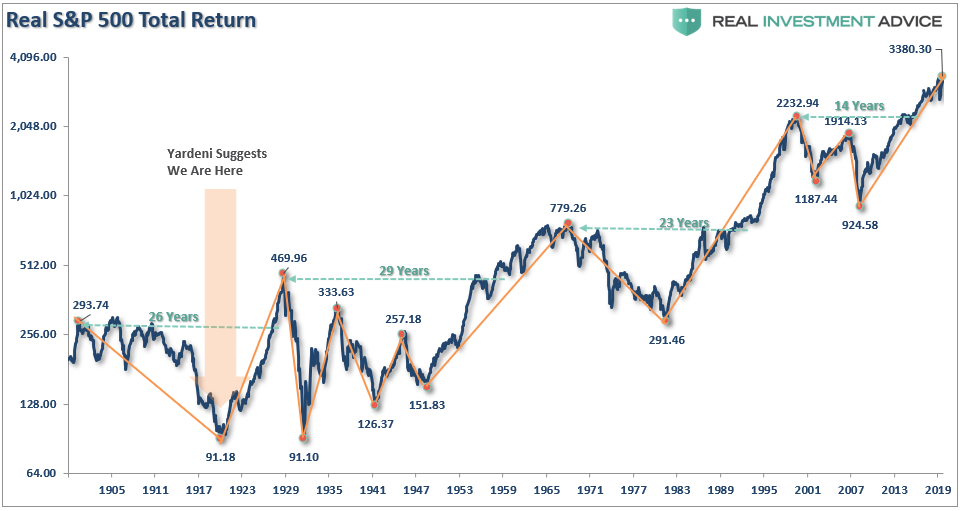 - Click to enlarge |
1920 Was The BottomYes, the ’20s marked the start of a period of marvel and rapid change. 1920 also marked the end of a 20-years of economic destruction. A series of events rocked the turn of the 20th century, which deeply suppressed financial markets. ((Imagine 20-years with negative total real returns.)
The market “melt-up” was undoubtedly driven by an economic recovery, a surge in innovation, etc. but was supported by historically low valuations. (Current valuations align with 1929 more than 1920.) |
SP500 Real Return vs. Valuations, 1905 - 2019(see more posts on S&P 500, )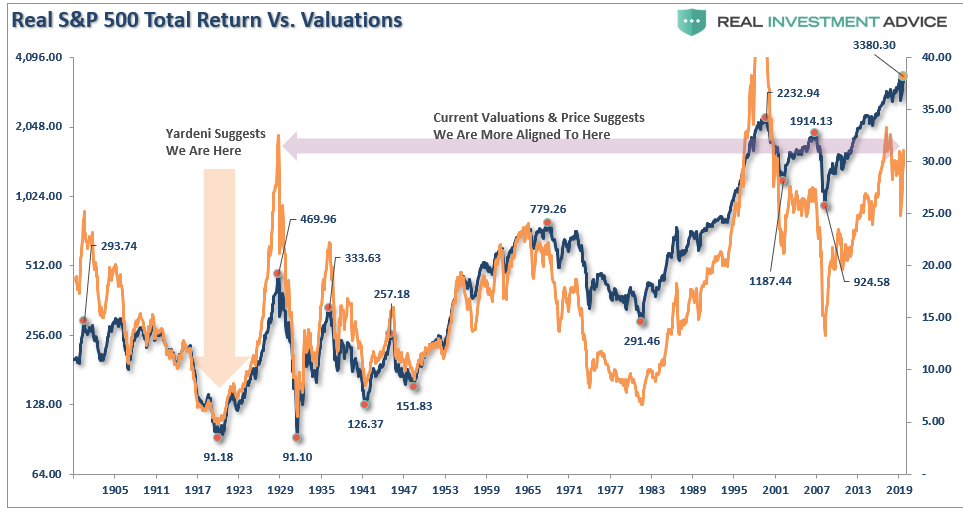 - Click to enlarge |
| While I certainly agree with the fact the companies today are spending a tremendous amount of money on technology and innovation, this is a significant difference.
The innovations in the early 1900s put increasing numbers of people to work. Those increases in jobs led to higher wages and more robust economic growth. Today, companies are spending money on innovation and technology to increase productivity, reduce employment, and suppress wage pressures. Look at the chart below. The history of the economy and related events shows the difference between then and now. Notice the strong economic growth rates in the 1920-1940 period as compared to today. Yardeni’s primary point is that history suggests a massive melt-up is coming for the financial markets. There are challenges to this view based on what history tells us about valuations and forward returns. |
GDP History Events and Population Growth, 1854 - 2019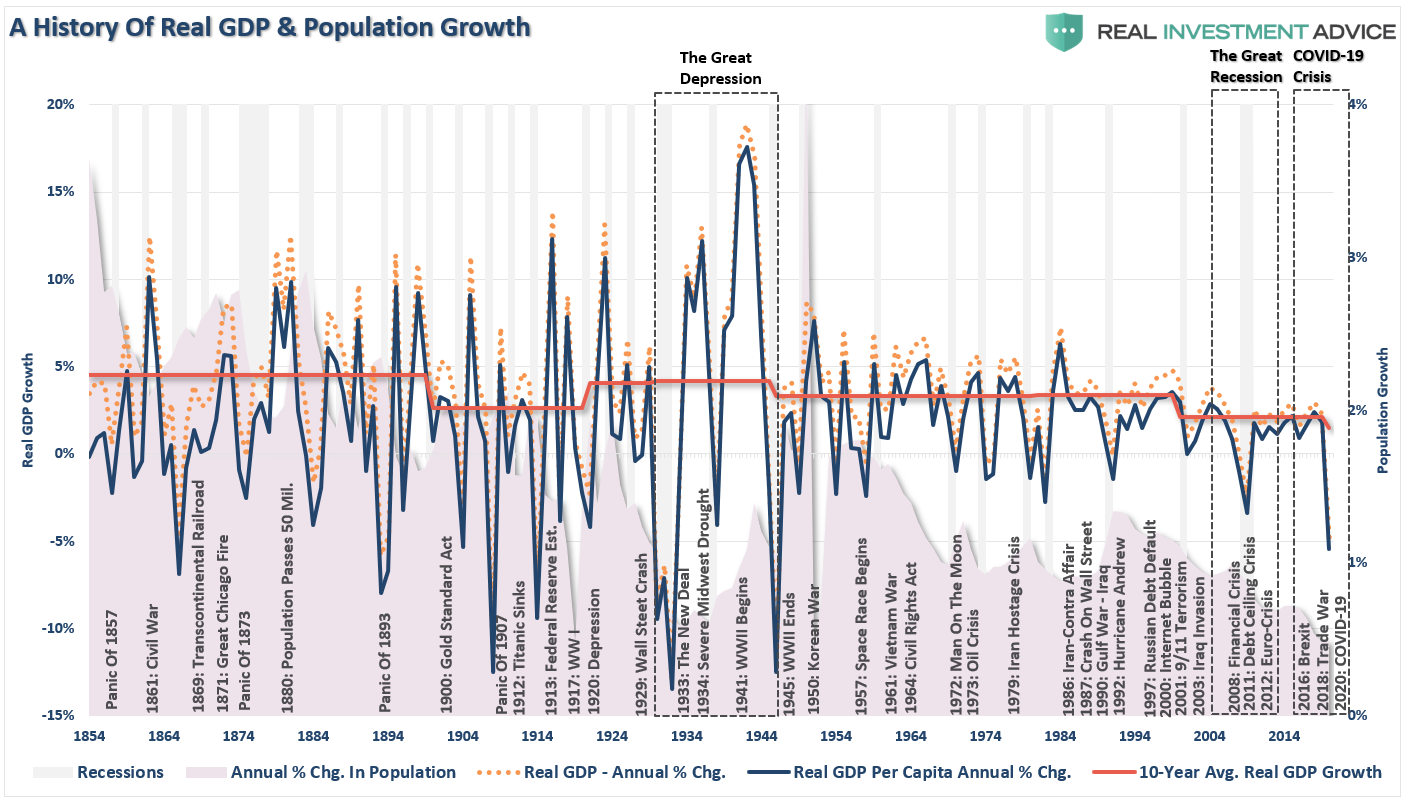 - Click to enlarge |
Valuations Don’t MatterIn the short-term, a period of one year or less, political, fundamental, and economic data has very little influence over the market. Such is especially the case in a late-stage bull market advance where the momentum chase has exceeded the grasp of the risk undertaken by investors. In other words, in the very short-term, “price is the only thing that matters.”
But in the long-term, fundamentals are the only thing that matters. |
10 Year Total Returns vs CAPE - Click to enlarge |
| Both charts below compare 10- and 20-year forward total real returns to the margin-adjusted CAPE ratio.
Both charts suggest that forward returns over the next one to two decades will be somewhere between 2-3%. |
20 Year Total Returns vs CAPE - Click to enlarge |
However, as we will discuss in more detail in a moment, they do matter. The chart below compares trailing valuations to forward 5-year returns on stocks. Again, as noted above, the disparity between current CAPE valuations today at 31x versus 5x earnings in 1920 could not be starker. |
PE Ration & Forward 5-Year Real Returns, 1904 - 2019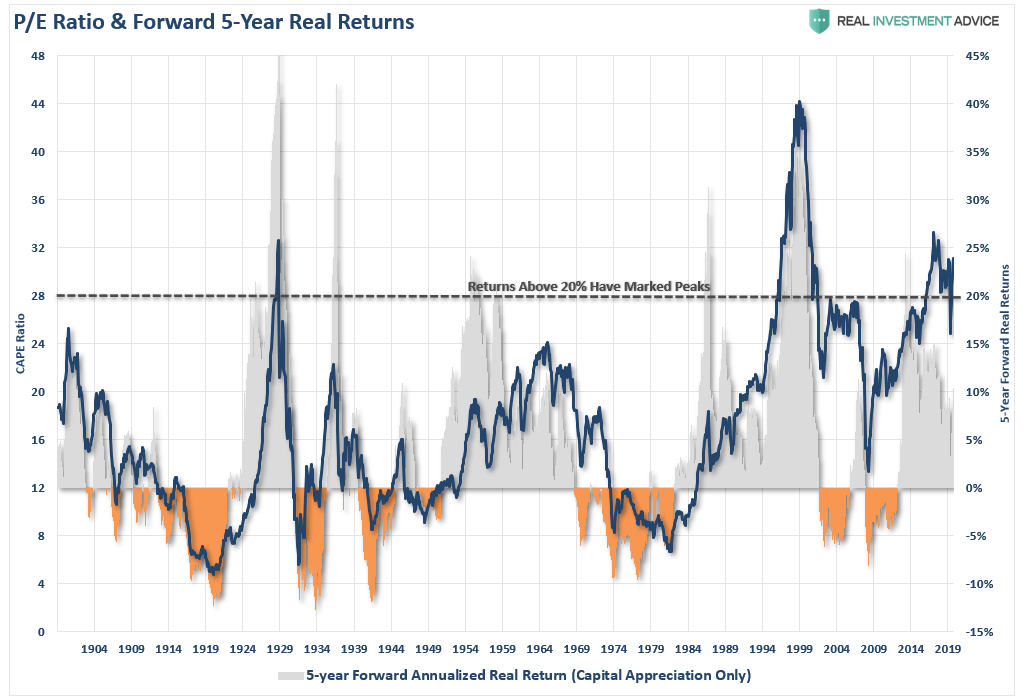 - Click to enlarge |
There are two crucial things you should take away from the chart above.
|
SP500 Borrowing From The Future, 2007 - 2020 - Click to enlarge |
Bogle And ThalerThe late Jack Bogle, the founder of Vanguard, confirmed the same:
Note: Bogle’s method differs from Wall Street’s. For his price-to-earnings multiple, Bogle uses the past 12 months of reported earnings by corporations, GAAP earnings, which includes ”all of the bad stuff.”
Note: Bogle also noted that Wall Street analysts look at operating earnings, “earnings without all that bad stuff,” to come up with a lower price-to-earnings multiple.
Richard Thaler, the famous University of Chicago professor who won the Nobel Prize in economics, also stated:
Wash, Rinse, & RepeatAs noted, the flood of liquidity, and accommodative actions, from global Central Banks, has lulled investors into a state of complacency rarely seen historically. However, while market analysts continue to come up with a variety of rationalizations to justify high valuations, none of them hold up under real scrutiny. The problem is the Central Bank interventions boost asset prices in the short-term; in the long-term, there is an inherently negative impact on economic growth. As such, it leads to the repetitive cycle of monetary policy.
If you don’t believe me, here is the evidence. The stock market has returned more than 130% since 2007 peak, which is more than 12x the growth in corporate sales and 3.6x more than GDP. |
|
Tobin’s QAs noted, valuations, by their very nature, are HORRIBLE predictors of 12-month returns should not be used in any strategy that has such a focus. However, in the longer term, valuations are strong predictors of expected returns. In the following series of charts, I am using forward 10-year returns just for consistency as some of the data sets utilized don’t yet have enough history to show 20-years of forward returns. The purpose here is simple. Based on a variety of measures, is the valuation/return ratio still valid, OR, is this time different? Tobin’s Q-ratio measures the market value of a company’s assets divided by its replacement costs. |
TobinsQ Ratio vs. 10yr Forward Returns, 1904 - 2019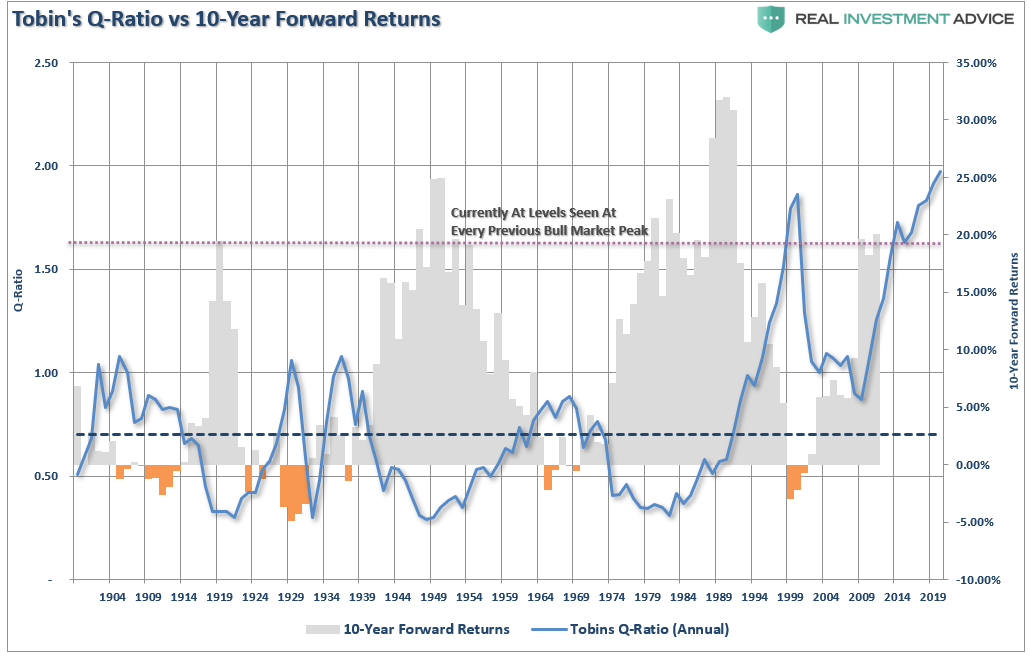 - Click to enlarge |
| The higher the ratio, the lower the future returns. |
TobinsQ Ratio & Shiller PE 10 vs. 10-Year Forward Returns, 1904 - 2019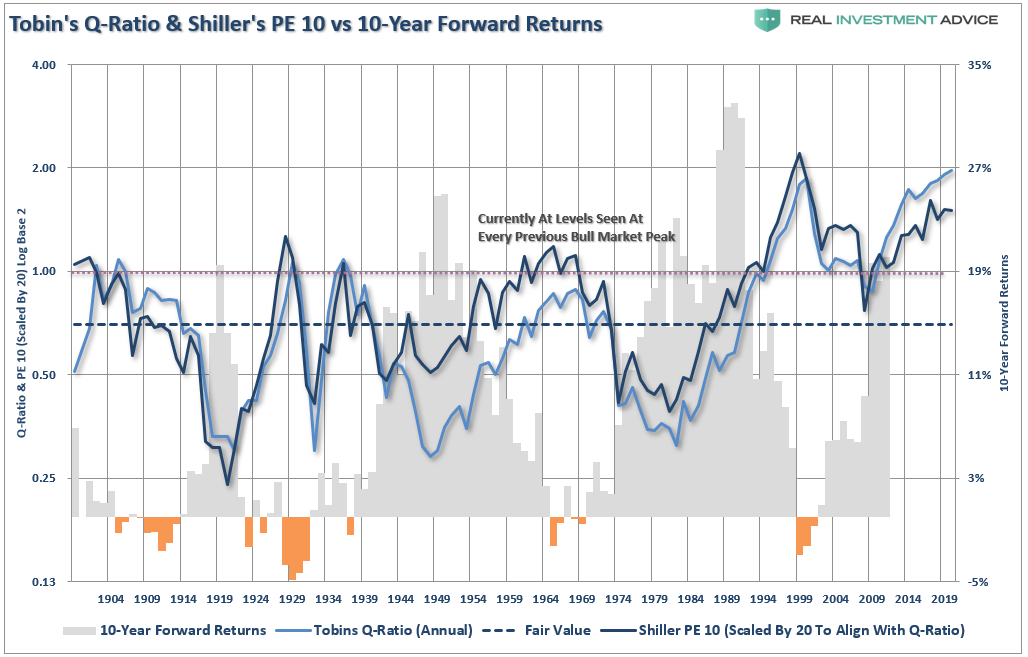 - Click to enlarge |
Just as a comparison, I have added Shiller’s CAPE-10. Not surprisingly, the two measures not only have an extremely high correlation, but forward return outcomes remain the same.
|
CAPE-10 Adjusted for Rates vs. 10-Year Forward Returns, 1905 - 2019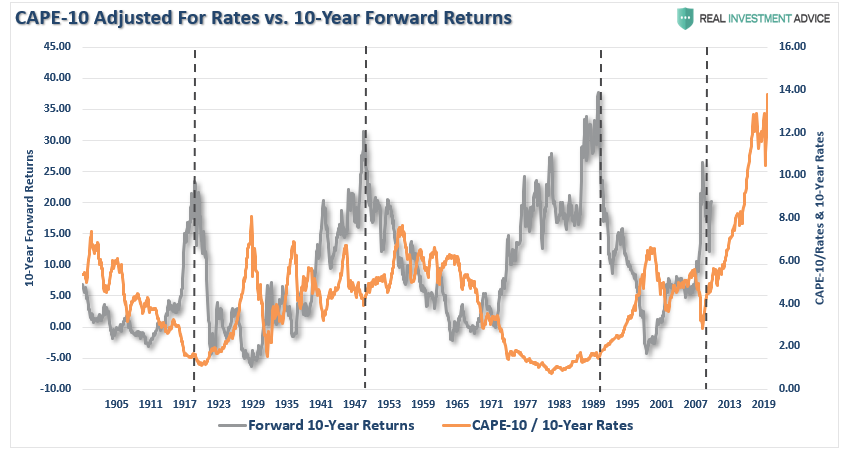 - Click to enlarge |
Rates, Sales & BuffettOne of the arguments has been that higher valuations are okay because interest rates are so low. Okay, let’s take the smoothed P/E ratio (CAPE-10 above) and compare it to the 10-year average of interest rates going back to 1900. The analysis that low rates justify higher valuations does not withstand the test of history. But since earnings are manipulated through a variety of accounting gimmicks, we can look at “sales” or “revenue,” which occurs at the top-line of the income statement. Not surprisingly, the higher the level of price-to-sales, the lower the forward returns have been. You may also want to notice the current price-to-sales is pushing the highest level in history as well. |
Price/Sales vs. 10-Year Forward Returns, 1964 - 2019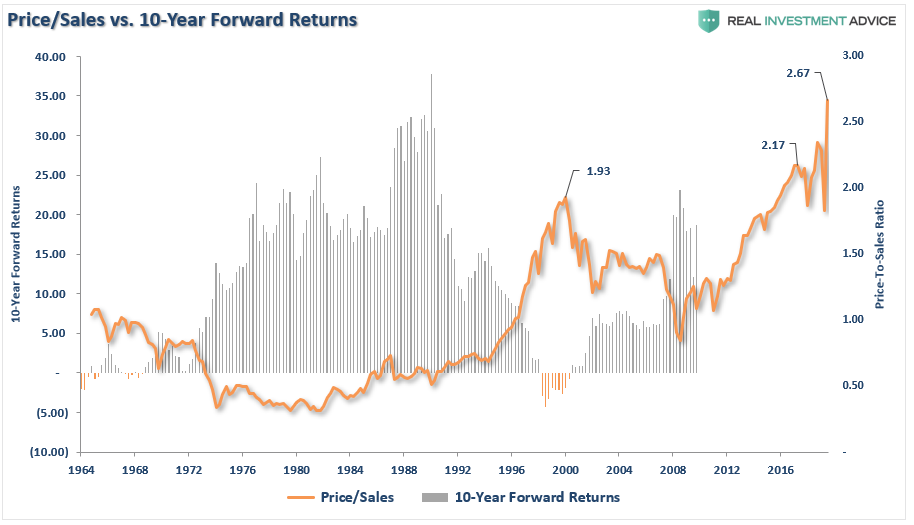 - Click to enlarge |
| Even Warren Buffett’s favorite indicator, market cap to GDP, clearly suggests that investments made today will have a rather lackluster return over the next decade. |
Buffett Indicator vs. 10-Year Forward Returns, 1971 - 2019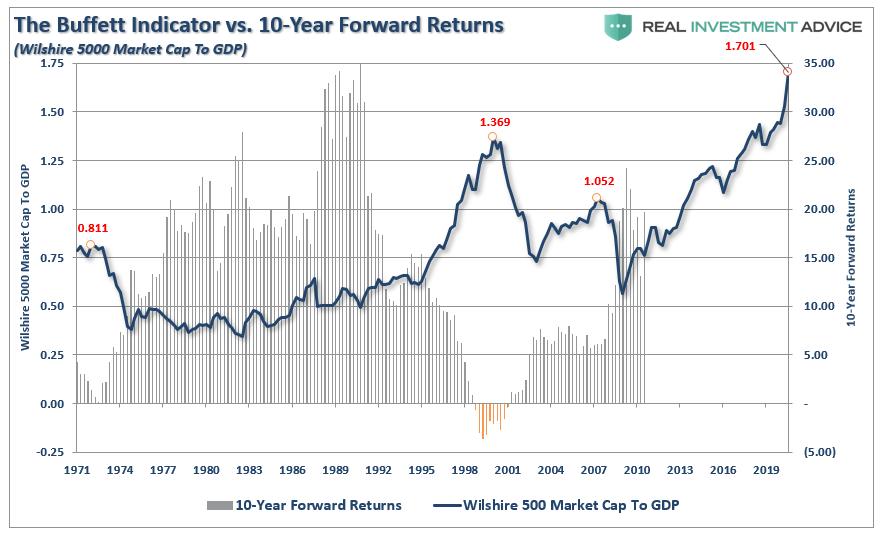 - Click to enlarge |
| If we invert the P/E ratio, and look at earnings/price, or more commonly known as the “earnings yield,” the message remains the same. |
Earnings Yield vs. Forward 10-Year Returns, 1905 - 2019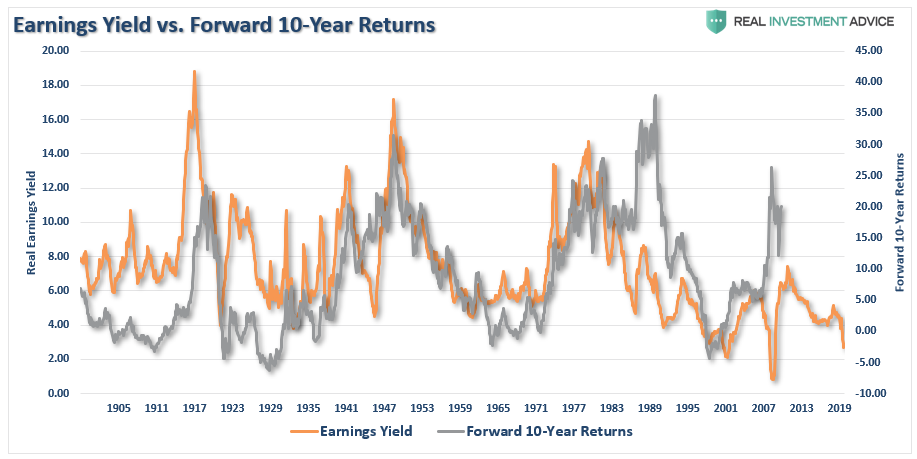 - Click to enlarge |
Conclusion
No matter how many valuation measures you use, the message remains the same. From current valuation levels, the expected rate of return for investors over the next decade will be low.
There is a large community of individuals who suggest differently, as they make a case as to why this “bull market” can continue for years longer. Unfortunately, any measure of valuation does not support that claim.
Such does not mean that markets will produce single-digit rates of return each year for the next decade. The reality is there will be some great years to be invested over that period. There will likely also be a couple of tough years in between.
That is the nature of investing. It is just part of the full-market cycle.
While I certainly hope Mr. Yardeni is correct in his thesis, valuations suggest differently.
The economic cycle, demographics, debt, and deficit, also suggest his optimistic view is unlikely.
Mr. Yardeni is correct on the point he made with his quote from Mark Twain:
“History doesn’t repeat itself, but it often rhymes.”
The post Technically Speaking: Why This Isn’t 1920. Valuations & Returns appeared first on RIA.
Full story here Are you the author?
Tags: Featured,Investing,newsletter,Technically Speaking


