


Jeffrey P. Snider
My articles My offerMy siteAbout meMy videosMy books
Follow on:LinkedINTwitterSeeking Alpha
These numbers do seem epic, don’t they? It’s hard to ignore when you have the greatest percentage increase in the history of a major economic account. Just writing that sentence it’s difficult to deny the power of those words. Which is precisely the point: we already know ahead of time how the biggest economic holes in history are going to produce the biggest positives coming out of them.
Whether that constitutes an actual recovery as opposed to the simplistic and more troubling rebound is the only question that ultimately matters. Here we are just as I said a week ago, a little further inside the window of the most fantastic figures ever.
Gigantic positive numbers like we’re going to see more and more don’t mean as much as you’ll be led to believe.
They only seem awesome if you completely ignore the even larger minuses which have preceded them everywhere…
The numbers look huge when you’ve been forced into starting from so small. If you aren’t careful, gargantuan positives can distract you from noticing the even more enormous hole and the tremendous damage you’ve already been stuck with. This kind of distraction will be the exact purpose of many over the coming months.
Wow! May retail sales show biggest one-month increase of ALL TIME, up 17.7%. Far bigger than projected. Looks like a BIG DAY FOR THE STOCK MARKET, AND JOBS!
— Donald J. Trump (@realDonaldTrump) June 16, 2020
| Seasonally-adjusted, US retail sales rose by 17.7% in May 2020 compared to April. And that prior figure was revised substantially higher, by nearly $9 billion, meaning the depths to the hole weren’t quite so deep.
And all that means is the same thing the employment numbers did – quite a lot of America reopened whether “allowed” to or not. When you put it on a chart, however, it’s not nearly so impressive. In fact, that’s how misleading these things can be; the rebound only looks good because the preceding collapse was mind bogglingly massive, far greater than this one step back up from that bottom. |
US Retail Sales, SA 2016-2020(see more posts on U.S. Retail Sales, ) - Click to enlarge |
| It is therefore assumed, given the rate behind the May estimates for retail sales and employment, this must herald the full-blown “V” scenario; the best of all best cases. Consumers are on their way all the way back, and in just a few months we’ll be right where we left off as if nothing happened.
That, however, isn’t analysis but rather (too) simplistic extrapolation. To begin with, just how far is the way back, really? It may not look all that daunting given the slope of this one month, but that May data (just May, not counting April) for retail sales leaves us still almost the same level of contraction as the economy experienced during the collapse part of the Great “Recession.” Substantially better than the absolute worse is a necessary but far from sufficient condition for recovery (see: below, 2009). |
US Retail Sales, Stagnation 1992-2020 - Click to enlarge |
| The first half of 2008-09 in terms of retail sales stuck to only a modest contraction. It wasn’t until August 2008 that it began to accelerate and then by October when it transitioned from recessionary to the worst anyone had seen since the thirties. By December, retail sales (seasonally-adjusted) were 11.5% lower and from there only modestly growing again (which some called a “recovery” when it was just a rebound).
After this one in May 2020, retail sales remain almost a complete Great “Recession” less than they had been when this fuss all began. So, America was reopened but a great deal of activity remains missing from it. Some will claim a more complete awakening will finish off the “V” in easy fashion, but that takes no account of the artificial factors at work (government payments, mostly) nor the situation beyond COVID-19. |
US Retail Sales and Inventory, SA 2007-2020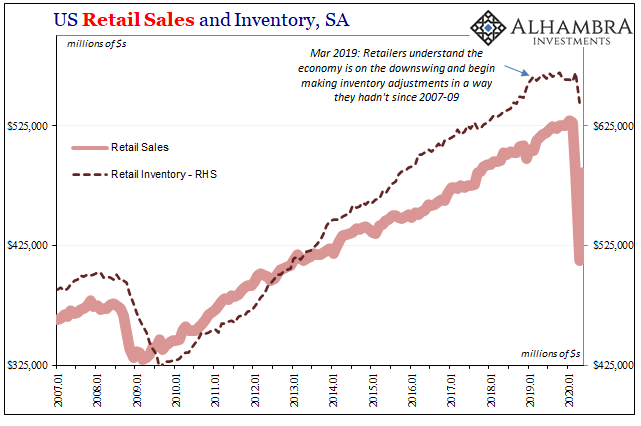 - Click to enlarge |
| You can see this best, I think, in the inventory situation of all things (Note: the inventory data above only goes through April, one more month further in arrears than sales figures). While Jay Powell continuously claimed the US economy was strong and robust in 2019, even though he was reluctantly forced into a complete 180-degree U-turn cutting rather than hiking rates, the retail industry wasn’t buying his nonsense. Literally.
The trajectory for retail inventories had shifted materially in a way it hadn’t since 2009. Powell said strong but retailers noticed the lack of strength in what they were trying to sell – meaning more and more unable at the margins. This kind of recognition had existed from the start of the pandemic and shutdowns. Add to them at least two months (March and April) of absolutely curtailed spending (for both economic and non-economic reasons) and then this rebound which falls short of a full return by a level nearly equivalent to the Great “Recession.” Maybe retail sales go back to even by mid-summer as a best case, but retailers therefore wholesalers and producers have to deal with the time as well as sales deficiency. |
US Retail Sales and Inventory, SA 2007-2020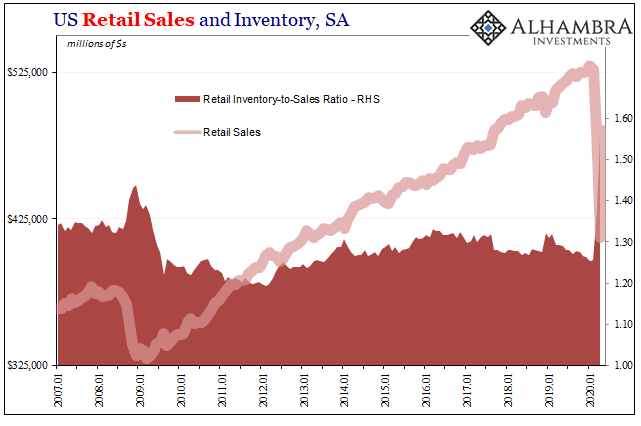 - Click to enlarge |
| The non-economic rebound may take shape, as it has in its first monthly step in May, but the economy remains incredibly short on demand. Production, including services (quite a lot of which is dedicated to managing, moving, and selling goods), is therefore going to be a drag on “recovery” (leaving all the mainstream, optimistic “Vs” are light on their right).
How do we know, this drag? Producers have “told” us that much at the other end of May’s rebound. Retail Sales may have jumped a long way back toward daylight from the depths, Industrial Production on the other hand barely moved off the bottom. And I mean barely: |
US Industrial Production, SA 2016-2020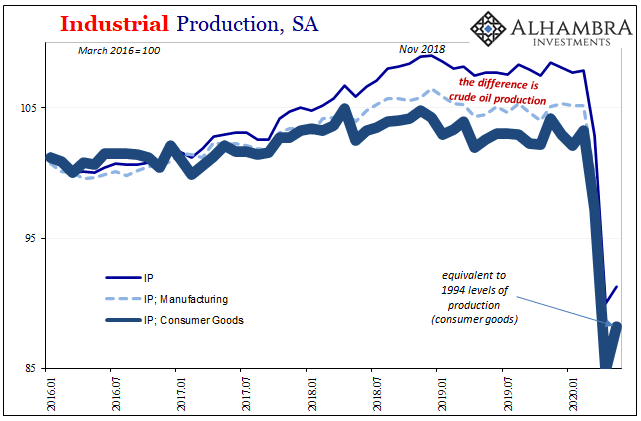 - Click to enlarge |
| Notice the pretty strong correlation between retailer inventory and production volumes, especially in manufacturing. Retailers at the outset of 2019, following 2018’s landmine, placed a halt on inventory growth which had already put the production sector of the economy into a recessionary state. Manufacturing recessions are dismissed in public as nothing much, but again rate cuts not hikes.
Then, beginning March 2020, the entire economy is called to a halt – while retailers still hadn’t worked through what is now by comparison a small inventory discrepancy. Today they are confronted with what amounts to a massive hole in lost activity that doesn’t get quantified by +17.7%. As I wrote, even after May’s surge retail sales remain nearly a whole Great “Recession” in the hole. It hasn’t gone unnoticed on the production side and like that prior nasty contraction it will likely come on in stages as second and third order effects play out despite the media’s infatuation with Jay Powell’s puppet show. |
US Industrial Production, Manufacturing SA 2011-2020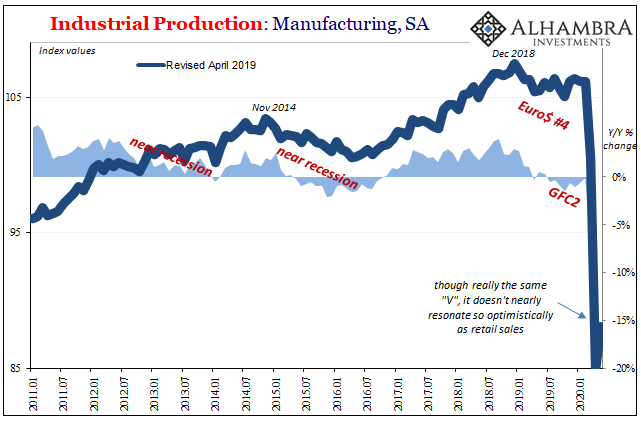 - Click to enlarge |
These are classic recessionary (meaning: economic) forces via the inventory cycle, only now boosted exponentially by the non-economic disruption presented by overactive governments who weren’t properly skeptical of statistical modeling (economics and epidemiology). In other words, retail sales like employment suggest the non-economic rebound, and the gigantic positives they’ll produce, while obscuring and still leaving the economic hole we’ve already suffered that hasn’t just disappeared.
Those who work at the Federal Reserve, like others, hope you won’t notice the difference even as big as it really is.
Full story here Are you the author?Tags: currencies,economy,Federal Reserve/Monetary Policy,industrial production,Inventory,inventory cycle,Markets,newsletter,recession,Retail sales


