|
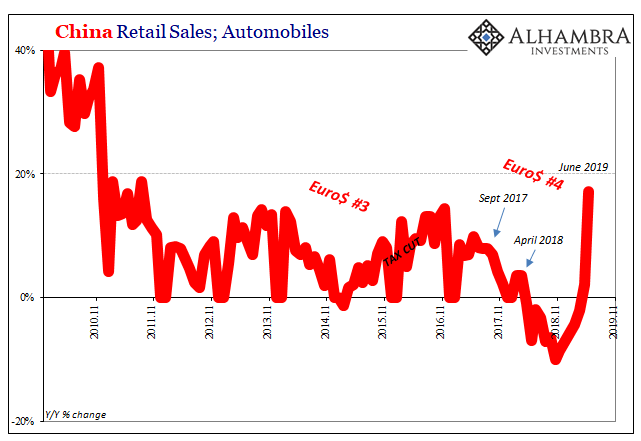
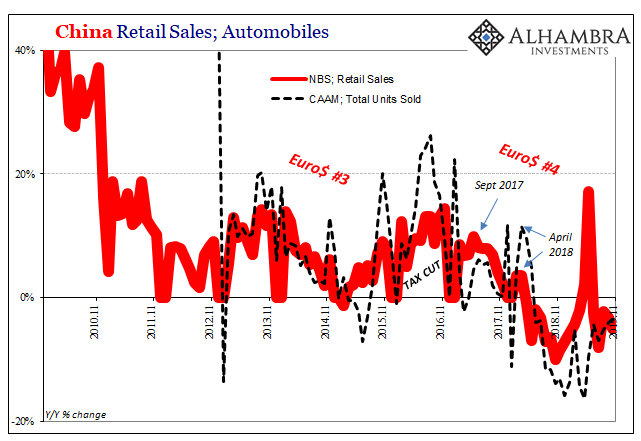
The Chinese government was serious about imposing pollution controls on its vast stock of automobiles. The largest market in the world for cars and trucks, the net result of China’s “miracle” years of eurodollar-financed modernization, for the Chinese people living in its huge cities the non-economic costs are, unlike the air, immediately clear each and every day. A new set of relatively strict pollution controls was added in the second half of this year. As is usual in these cases, manufacturers and retailers rushed to sell as much old inventory as possible before the regulations took effect. Price discounting was rumored to be massive in some places. Everyone knew that car sales would jump as a result. What China’s National Bureau of Statistics (NBS) reported in the middle of July, however, was far more than most had anticipated. According to the government’s calculations, retail sales of autos exploded by 17.2% in June 2019 when compared to June 2018. And that followed a modest 2.1% year-over-year gain during May (not accumulated). Before then, vehicle retail sales had contracted for ten straight months going back to May 2018, often sharply. |
China Retail Sales, 2010-2019(see more posts on China Retail Sales, ) |
Even though there was an artificial boost in the numbers, they were still viewed as encouraging, much better than expected even factoring the price behavior. All over the world the financial media whispered cautiously, but optimistically, that maybe China had found its bottom and turned an important corner. Here’s one example:
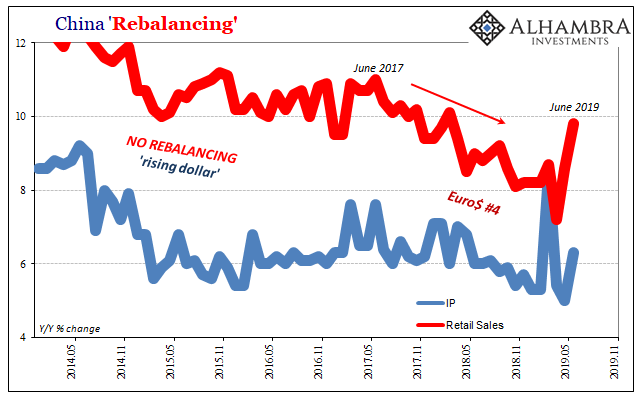
It began to appear as if regardless of emissions protocols the Chinese car market had seen its worst back in November 2018. From then on, the market seemed like it was starting to find its footing throughout the first half of 2019. The effect on overall spending in China particularly during June was pronounced. The NBS reported that total Retail Sales during that month had spiked, too, rising 9.8% year-over-year. It was the first monthly gain near double-digits since the prior spring. And if China’s enormous automobile market was finally coming back to life, the improvement observed across the vast industrial sector looked consistent with all that, too. |
China Rebalancing, 2014-2019 |
| In terms of Chinese Industrial Production, that statistic had recorded its own massive jump during March 2019. It had increased 8.5% year-over-year, the first time IP had been better than 8% since the summer of 2014.
Green shoots China-style. And if China really was moving to an upswing, would the whole global recovery be far behind? That was, of course, only the most charitable way to interpret all these Chinese figures. There was another, as I wrote at the time in mid-July. The data had become very noisy month-to-month, as such it was important to keep those downswings in mind rather than just concentrating entirely on the upswings.
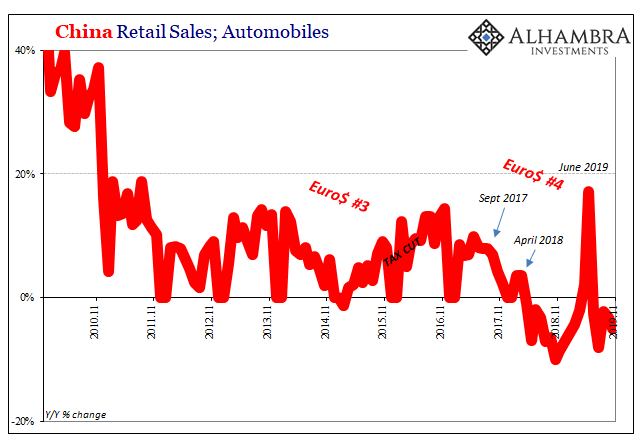
That mid-year acceleration, of course, really did turn out to be nothing, petering out very quickly. |
China Retail Sales, 2010-2019(see more posts on China Retail Sales, ) |
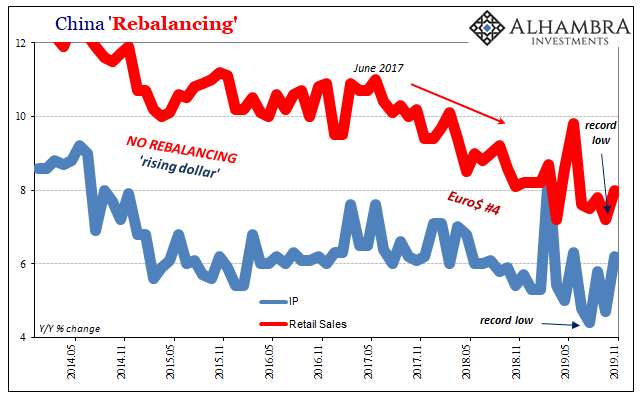
| China’s car sales resumed their decline immediately in July, as did record lows in IP as well as total retail sales (2nd lowest on record) over this past summer. |
China Rebalancing, 2014-2019 |
| The figures since June have alternated on a monthly basis; real weakness one month followed by a modest upturn the next – just like we’ve noted in other key numbers elsewhere.
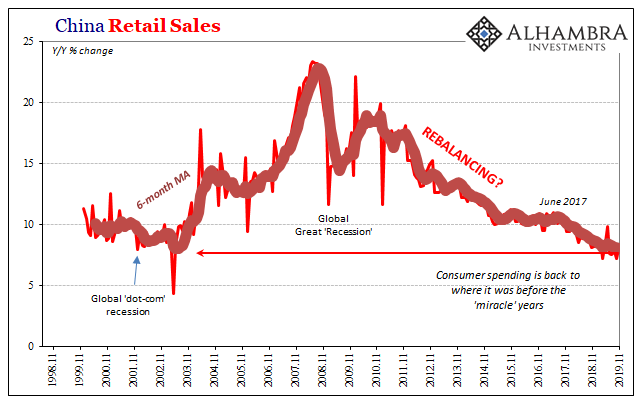
For the month of October, that was on the downside across Chinese data. Therefore, it was unsurprising that the NBS reported rebounding estimates for the month of November 2019. Industrial Production, which had gained just 4.7% year-over-year the prior month, only the fifth time since records began that IP grew by less than 5%, accelerated to 6.2% year-over-year last month. Retail Sales during October, having matched April’s second worst on record (7.2%), moved up to 8% during November. And that included skyrocketing food price inflation. |
China Retail Sales, 1998-2019(see more posts on China Retail Sales, ) |
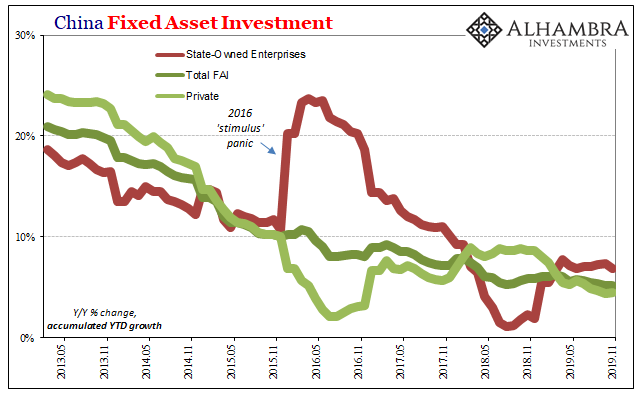
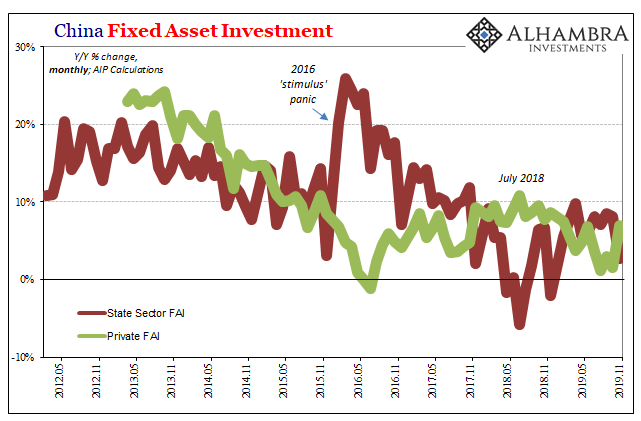
| In terms of FAI, the accumulated total across both private industry and state-owned businesses remained at a record low for the second straight, gaining just 5.2%. The private sector swapped with the public sector in terms of each’s relative level of monthly activity. In the former, the accumulated rate increased to 4.5% up to November from 4.4% up to October. On a monthly basis alone, the gain improved to 6.9% from 1.1% the month before. |
China Fixed Asset Investment, 2013-2019 |
| The numbers appear to be somewhat distorted; the government seems to have reclassified some state-owned FAI as private – at least during November.
In any case, the overall FAI result doesn’t suggest, at least not yet, the possibility of a drastic change in Xi’s general economic stance. While the Communist Party likes to keep things to round numbers, making policy changes at each year end, as you can see above (June 2018), if authorities deem it necessary they will intervene with fiscal spending (SOE FAI). That wasn’t the case at least during November. |
China Fixed Asset Investment, 2012-2019 |
| Chinese data is, once again, on an upswing.
That by itself tells us little if not nothing. The question is whether this is a material change in economic condition, and, if so, why? The dollar condition became slightly less harsh starting in early September (repo fireworks notwithstanding) but so far that hasn’t equated to a categorical change. Maybe China really was ramping up for the anticipated end to the “trade wars.” If so, the months ahead would have to follow an entirely different pattern. |
China Retail Sales, 2010-2019(see more posts on China Retail Sales, ) |
Full story here Are you the author? Previous post See more for Next post
Tags: Auto Sales,China,China Retail Sales,consumer spending,currencies,economy,fai,Federal Reserve/Monetary Policy,fixed asset investment,industrial production,Markets,newsletter,Retail sales


