


Joseph Y. Calhoun
My articles My siteAbout meMy videosMy books
Follow on:LinkedINTwitterSeeking AlphaAmazon
Is the recession scare over? Can we all come out from under our desks now?
The market based economic indicators I follow have improved since my last update two months ago. The 10 year Treasury rate has moved 40 basis points off its low. Real interest rates have moved up as well but not quite as much. The difference is reflected in slightly higher inflation expectations.
The yield curve has also steepened as the 10 year Treasury yield rose faster than the 2 year. This is not the type of steepening we normally expect to see just prior to recession by the way. That would be if the 2 year yield was falling faster than the 10 year. On the other hand, the change here is not large even if it is in the right direction.
As you’ll see below, some of our other market indicators are also pointing to an improved economic outlook even as the data itself has continued to weaken, especially on the manufacturing side of the economy. The CFNAI, one of our favorite broad economic indicators, came in at -0.45 for September, a pretty big retreat from August’s revised reading of 0.15. All that means though is that the economy is growing below trend, something that shouldn’t surprise anyone reading Alhambra’s commentary. I’ve said for the last year that we were slowing back to trend and that an overshoot was likely. Well, here we are, but it isn’t recession. Yet.
When the yield curve inverted a few months back I warned that, even if it was a precursor to recession, it didn’t mean it was imminent. $20 trillion economies do not turn on a dime. There is an ebb and flow to the economy that reflects its human nature. It is our actions in anticipation of economic slowdown (acceleration) that, to some degree, create the conditions for the slowdown (acceleration). Everyone doesn’t act and react at the same pace and so the economy slows and accelerates in fits and starts (usually). As events unfold, people’s perception of the economy change and their actions change too. A “phase one” China deal improves the outlook for trade and some people move from “recession” to “no recession”. Others look at the same deal and think no progress is being made.
Maybe this recession scare is over – stock market investors sure seem to think so – but there will be others. Investors need to be careful not to overreact to every little economic wiggle. Try to keep things in context and look for confirmation across multiple markets. And don’t be surprised at how long these changes take. We may still be on the glidepath to recession and the recent improvement in our market indicators could be just part of that normal ebb and flow. Maybe markets are anticipating some positive event – a trade deal perhaps – that doesn’t happen and all this improvement gets reversed. Or maybe the positive event does happen and economic growth accelerates again. And when that event passes there will be another to ponder.
No one can predict the future course of the economy. Humans are inherently unpredictable, especially in a crowd environment like markets. Fortunately, we don’t need to predict anything to be good investors. All we need to do is figure out the present, a simple task complicated by our own, very human, emotions and biases.
10 Year Treasury YieldThe 10 year yield is 40 basis points off its low, nominal growth expectations rising from the dead. Still, a 1.85% 10 year isn’t saying a lot of good things about future growth. |
10-Year Treasury Yield, 2017-2019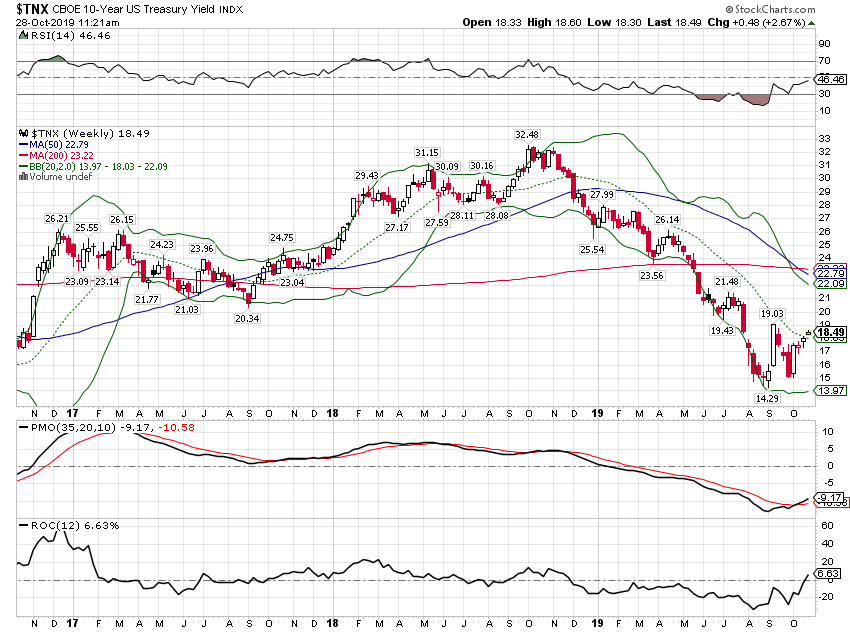 - Click to enlarge |
| Rates have been down here several times during this business cycle so this isn’t exactly new. Welcome to the secular stagnation. |
10-Year Treasury Yield, 2007-2019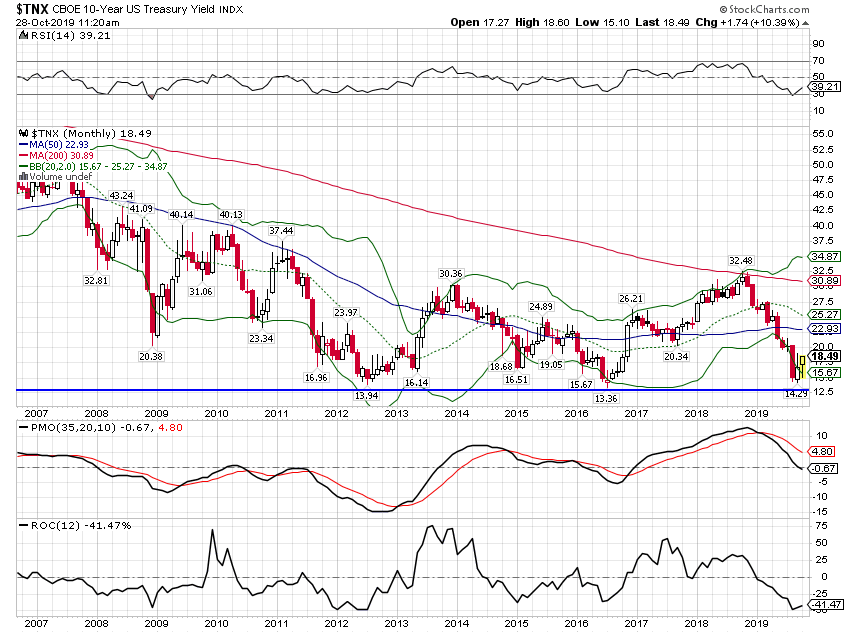 - Click to enlarge |
10 Year TIPS YieldsReal yields also moved up but not as much as the nominal yield. Yes, this is a positive but not a big one. |
10-Year Treasury Inflation-Indexed Security, 2015-2019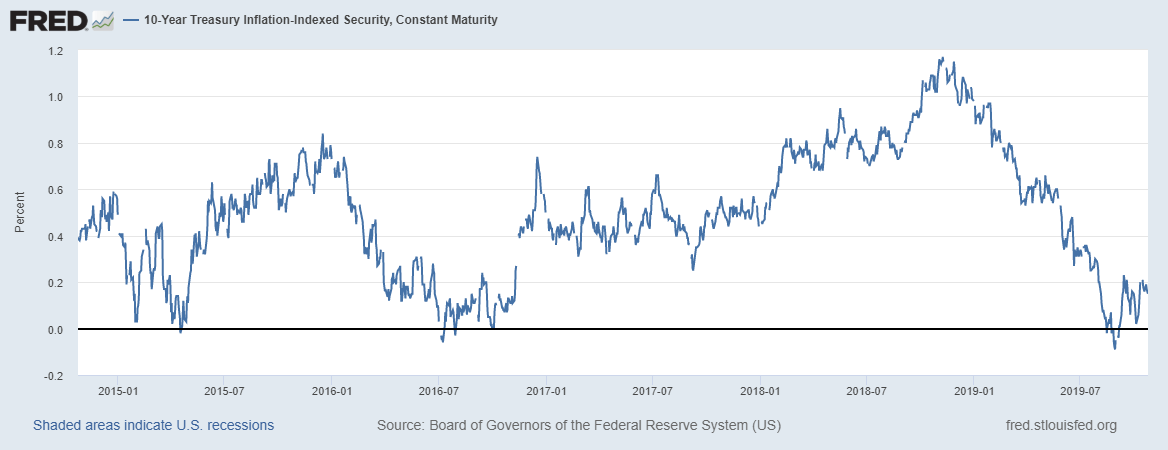 - Click to enlarge |
| Like the nominal bond yield, real rates have been stuck at these low levels this entire business cycle. Real rates this low are a reflection of weak investment and productivity growth. Until you see higher real rates, don’t expect any sustainable pickup in real growth. |
10-Year Treasury Inflation-Indexed Security, 2004-2019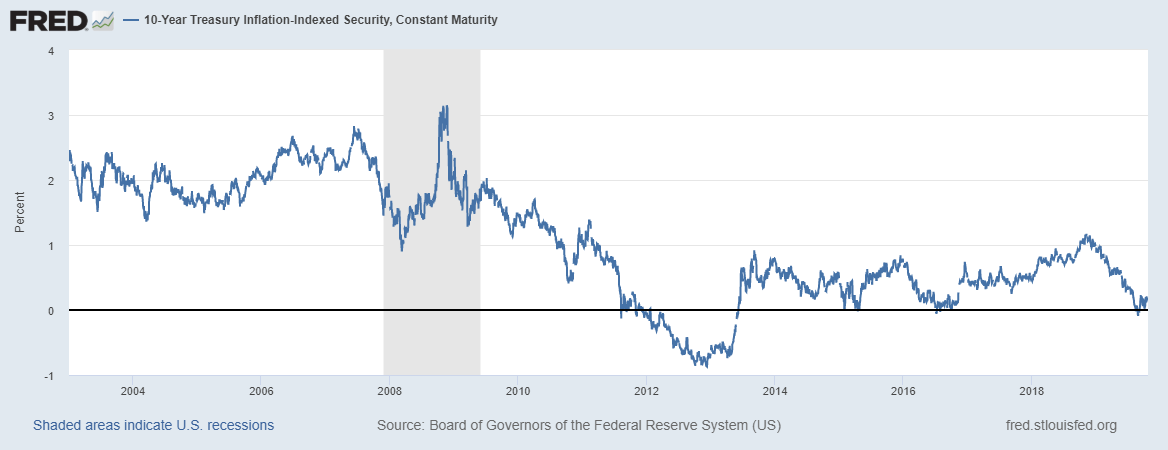 - Click to enlarge |
Inflation ExpectationsInflation expectations have risen modestly as nominal rates rose faster then real rates. The trend is still down. |
10-Year Breakeven Inflation Rate, 2015-2019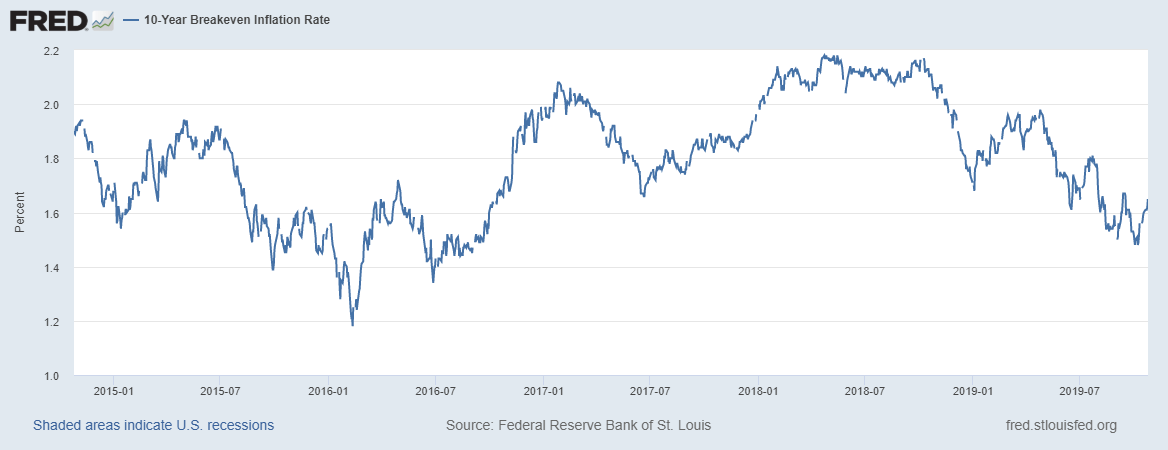 - Click to enlarge |
2 Year Treasury Note YieldYields have risen but not as fast as the 10 year. Again, a positive but growth expectations are still low. |
2-Year Treasury Yield, 2019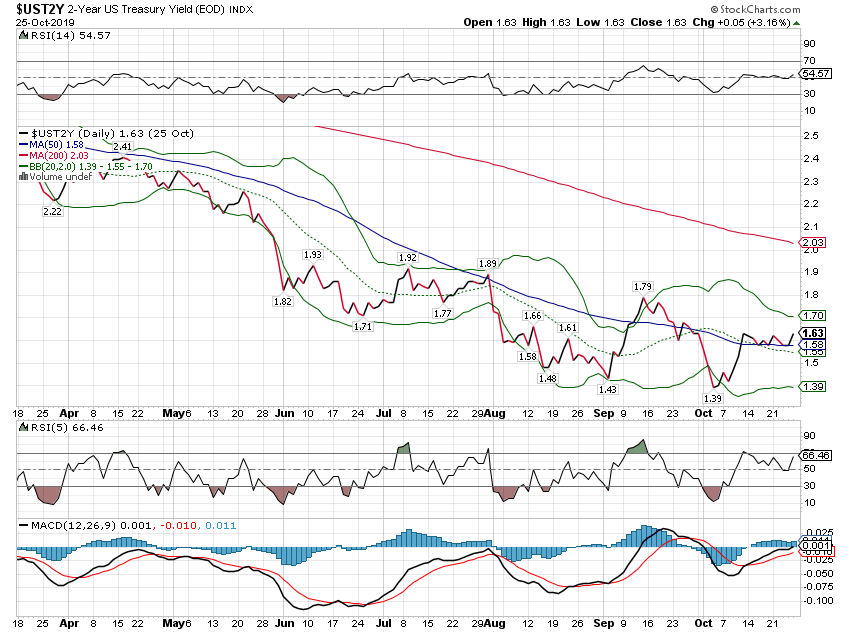 - Click to enlarge |
| The 2 year yield has merely pulled back to the previous trend. |
2-Year Treasury Yield, 2007-2019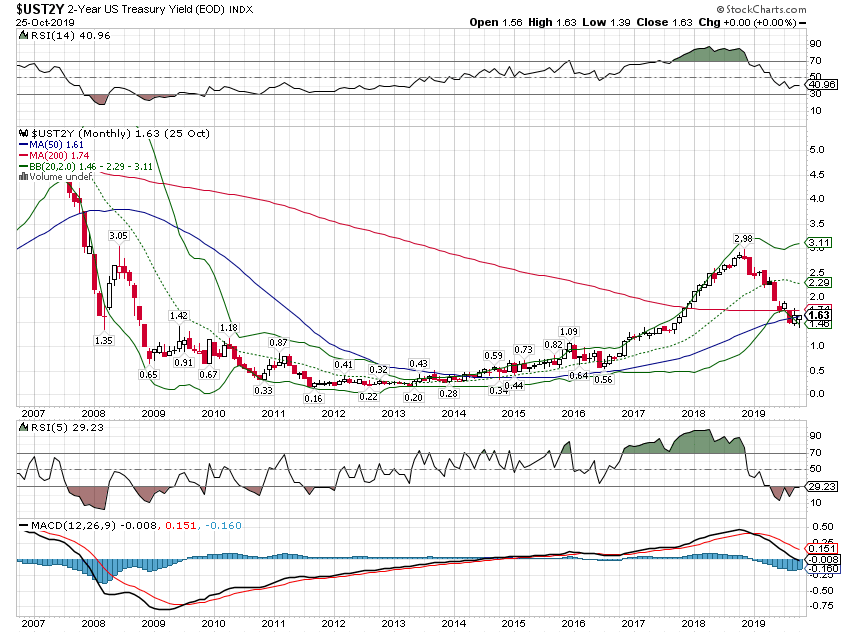 - Click to enlarge |
Yield CurveThe steepening of the curve is a positive but it isn’t a big change. This puts us back where we were all the way back in July. |
Yield Curve - 2 Year Bonds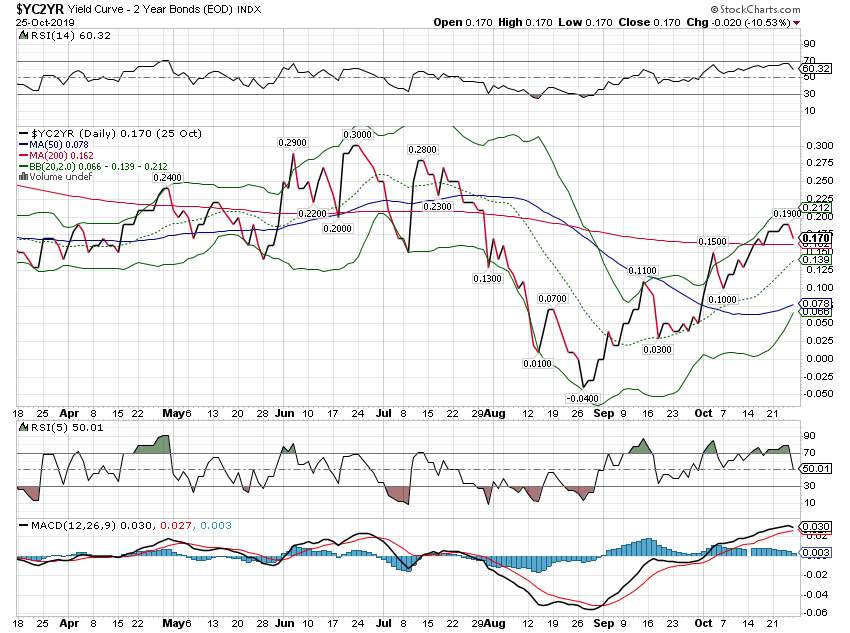 - Click to enlarge |
| Based on history, this means….heck I don’t know. This could be the fabled soft landing like back in the mid-90s and we’ve got five more years before recession or it could be like the Asian crisis in ’98. Or it could be something we’ve never seen before. In other words, by itself, this doesn’t tell us much. |
10-Year Treasury Constant Maturity Minus 2-Year Treasury Constant Maturity, 1986-2018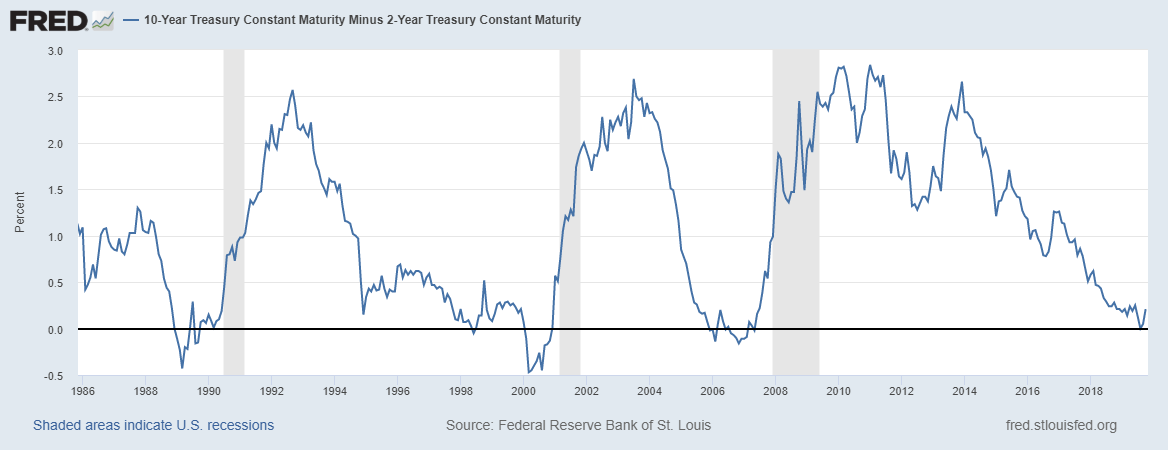 - Click to enlarge |
Credit SpreadsCredit spreads never confirmed the negativity in the other bond markets and it still doesn’t. Spreads are only slightly elevated from the best levels of this cycle. |
ICE BofAML US High Yield Master II Option-Adjusted Spread, 2010-2019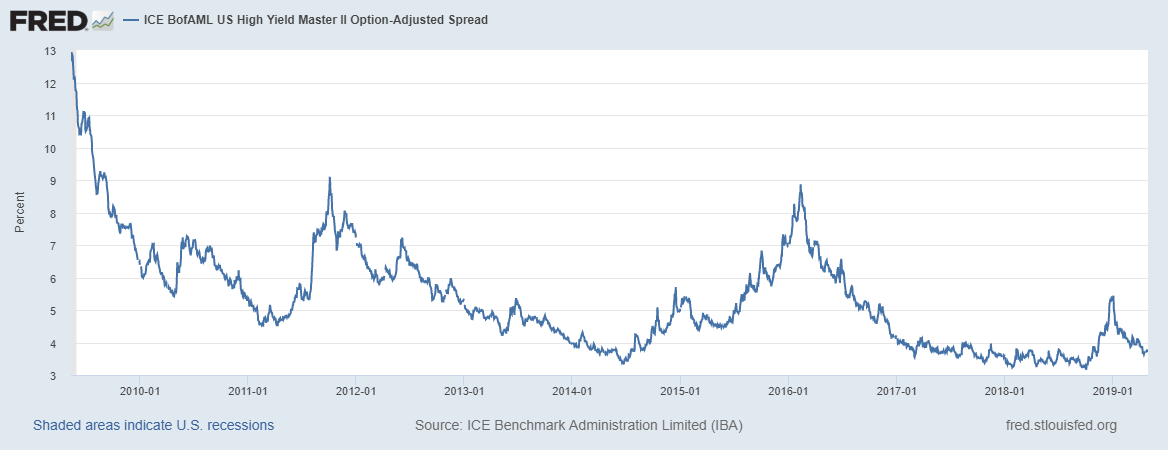 - Click to enlarge |
| This could be concerning. The lowest rated junk bond spreads are trending wider so there is the beginnings of stress in the junkiest of the junk. Interestingly, in the last two recessions, CCC spreads blew out at the same time as higher rated stuff. So if this turns out to be a canary in the coal mine it will be a new canary. A contrarian might see this as opportunity. If the economy rights itself you could probably pick up some alpha owning these bonds. Of course, anything in this market is speculative so buyer beware. And just an FYI, we won’t be buying any of these; not our game. |
ICE BofAML US High Yield CCC or Below Option-Adjusted Spread, 2015-2019 - Click to enlarge |
US DollarThere has been some recent weakness but the dollar really hasn’t changed much in the last two months. |
US Dollar Index, 2017-2019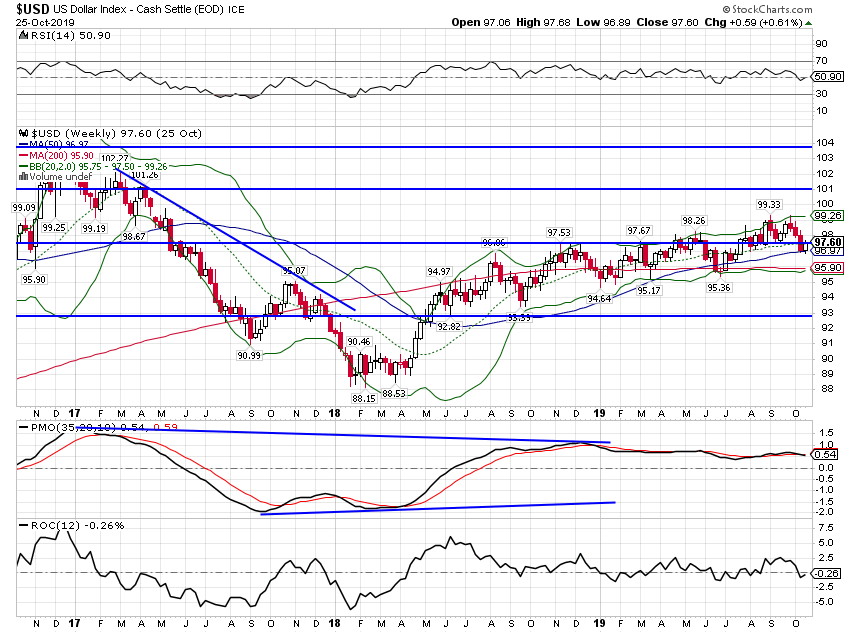 - Click to enlarge |
| For that matter, except for the volatility around the last election, the dollar hasn’t done much for the last 4 years. That’s a good thing in case you were wondering. |
US Dollar Index, 2007-2019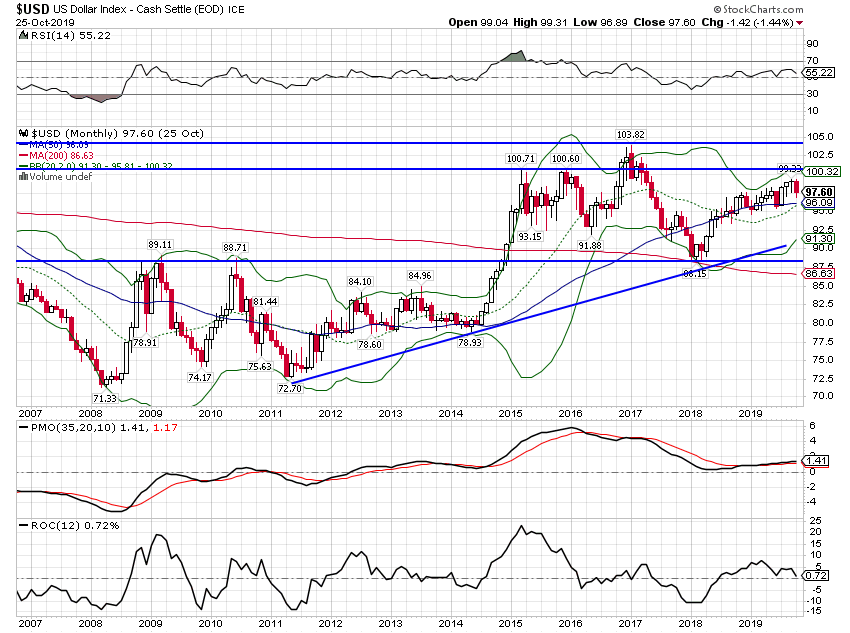 - Click to enlarge |
GoldGold has flattened out as growth concerns have faded. Whether this is a pause, a consolidation, before moving higher will depend on how growth expectations change in the coming months. If we start seeing better data or a real trade deal, expect a further pullback with $1400 as a first target. |
Gold, 2019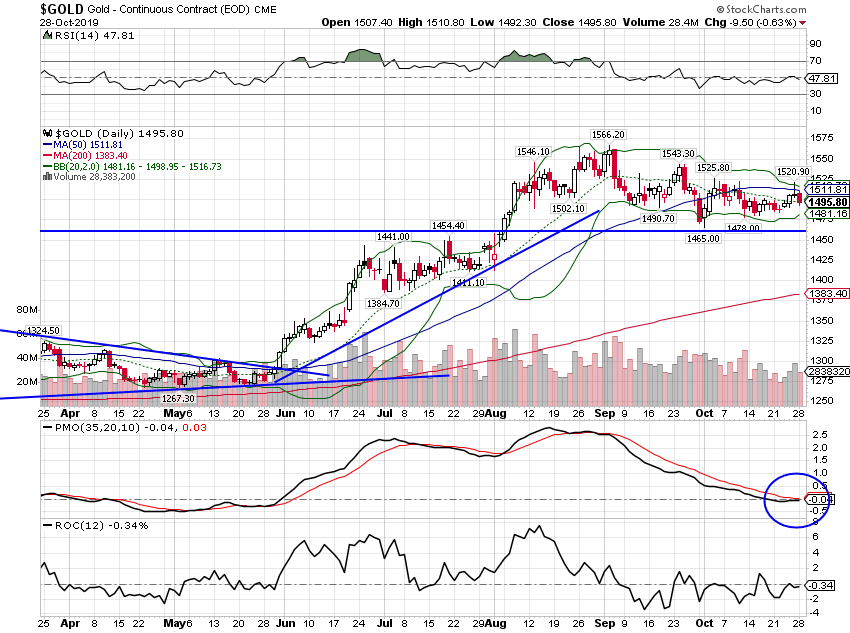 - Click to enlarge |
| We’ll see if the break out higher holds but the big spec long in gold futures still exists. It might take a bigger pullback into the $1300s to clear out some of the longs. |
Gold-monthly, 2008-2019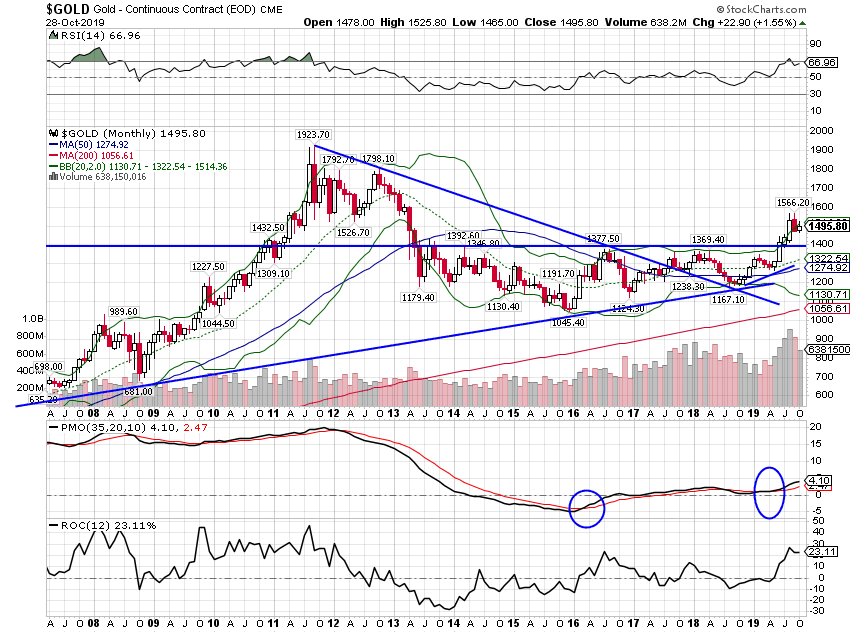 - Click to enlarge |
Commodity IndexesCommodities haven’t done much this year but have recently moved off the lows of this year’s range. |
DJP weekly, 2017-2019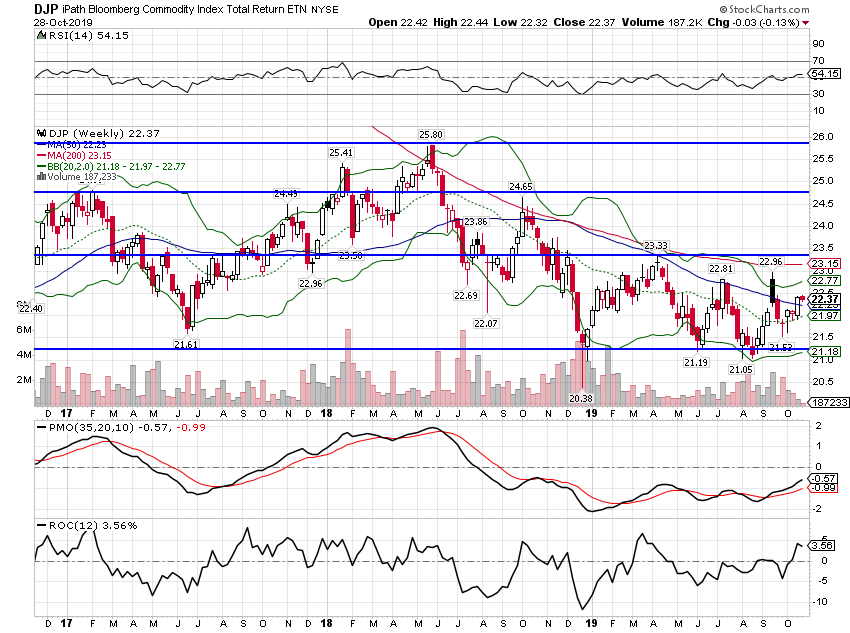 - Click to enlarge |
GSP weekly, 2017-2019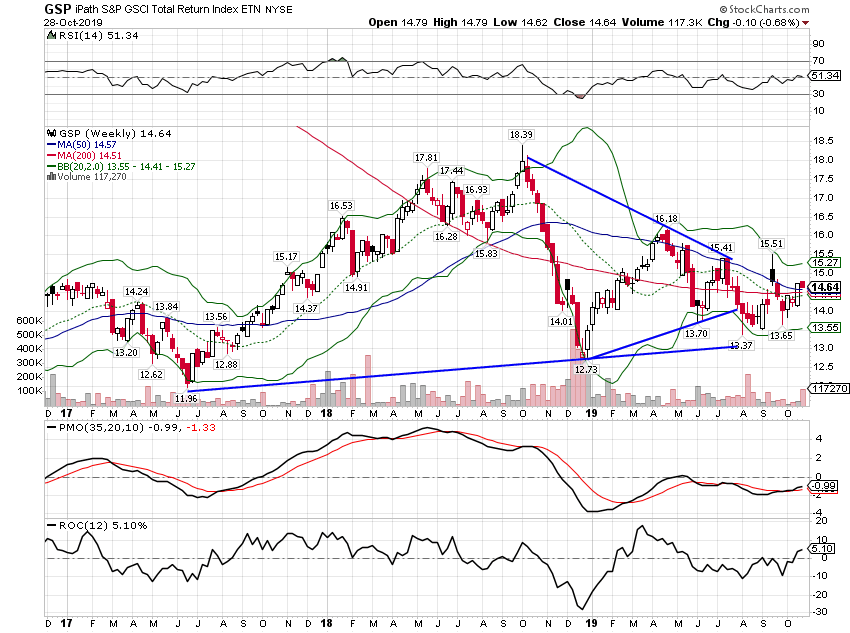 - Click to enlarge |
|
| The copper:gold ratio has also moved up as gold pulled back and copper rallied off the lows. Again, like a lot of these indicators, the direction is positive but the magnitude just isn’t enough to get excited about. At least things have stopped getting worse. |
Copper Gold-weekly 2017-2019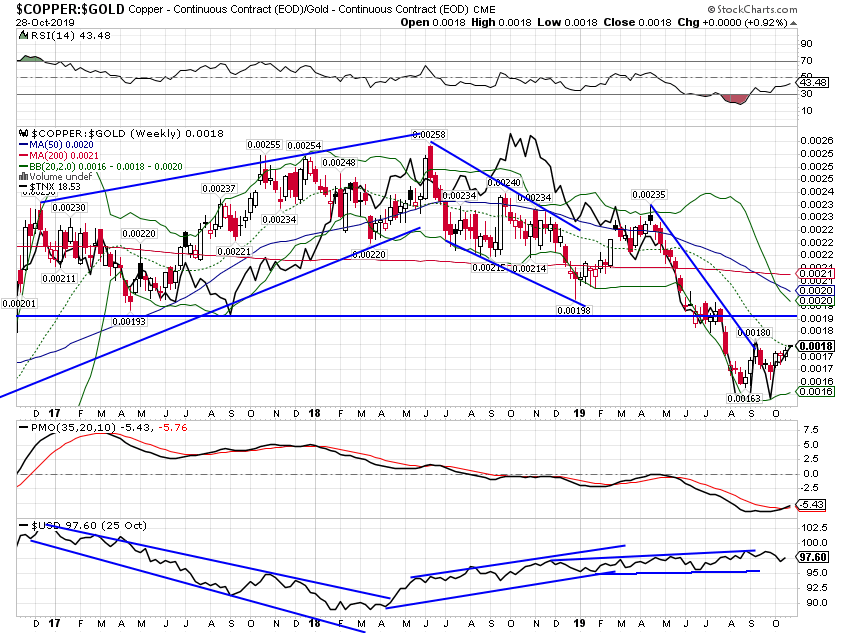 - Click to enlarge |
| Gold continues to outperform the general commodity index but this is about as far above trend as this gets. A further pullback of gold relative to general commodities makes sense from a technical perspective. That would probably mean a positive change in growth expectations if it happens. |
IAU:DJP monthly, 2007-2019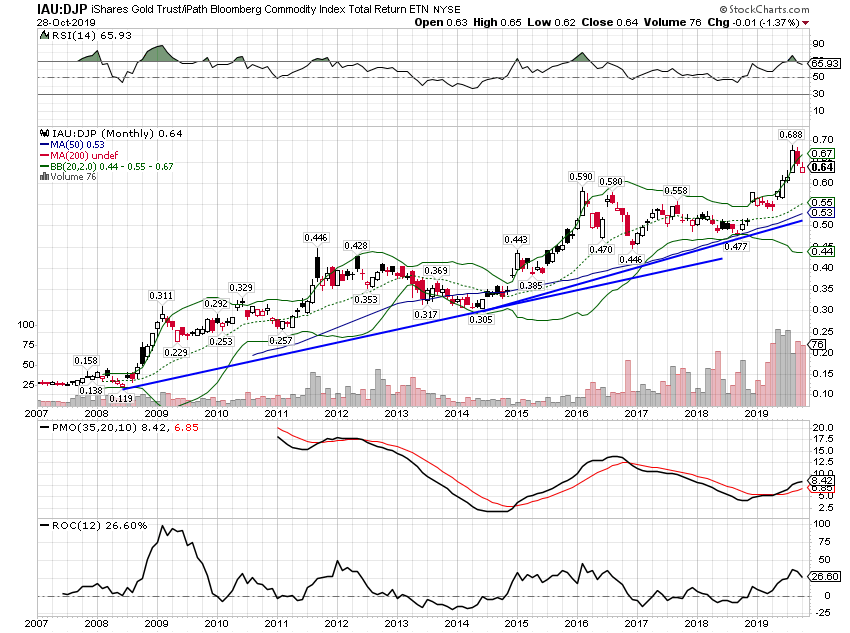 - Click to enlarge |
The growth scare has waned a bit but the economy isn’t out of the woods by a long shot. At best, current markets are predicting weak growth. That isn’t surprising to me and it really shouldn’t be to anyone. Economic policymakers still haven’t found the magic elixir that gets us out of the New Normal. The Trump administration has mixed positive (tax cuts) with negative (trade war) and gotten just about what you’d expect from that – not much.
But, it isn’t recession and we’ve been investing in a weak growth environment for 10 years so this isn’t new. Weak growth and a fairly stable dollar isn’t great but it isn’t bad either. As we’ve seen for most of that 10 years, this environment is pretty positive for stocks even if they are expensive. A change in the environment – weaker dollar, stronger growth – might dictate a change to your portfolio but for now we remain stuck in the same rut we’ve been in for the last decade. Keep calm and carry on.
Full story here Are you the author?Tags: Alhambra Research,bond yields,Bonds,commodities,credit spreads,currencies,dollar,economy,Gold,inflation expectations,Interest rates,Markets,New Normal,newsletter,secular stagnation,TIPS,Yield Curve


