


George Dorgan
My articles My siteAbout meMy videosMy books
Follow on:LinkedINTwitterSeeking Alpha
CFA SocietyEconomicBlogs
We do not like Purchasing Power or Real Effective Exchange Rate (REER) as measurement for currencies. For us, the trade balance decides if a currency is overvalued. Only the trade balance can express productivity gains, while the REER assumes constant productivity in comparison to trade partners.
Who has read Michael Pettis, knows that a rising trade surplus may also be caused by a higher savings rate while the trade partners decided to spend more. This is partially true. Recently Europeans started to increase their savings rate, while Americans reduced it. This has led to a rising trade and current surplus for the Europeans. But also to a massive Swiss trade surplus with the United States, that lifted Switzerland on the U.S. currency manipulation watch list.
To control the trade balance against this “savings effect”, economists may look at imports. When imports are rising at the same pace as GDP or consumption, then there is no such “savings effect”.
After the record trade surpluses, the Swiss economy may have turned around: consumption and imports are finally rising more than in 2015 and early 2016. In March the trade surplus got bigger again, still shy of the records in 2016.
Swiss National Bank wants to keep non-profitable sectors alive
Swiss exports are moving more and more toward higher value sectors: away from watches, jewelry and manufacturing towards chemicals and pharmaceuticals. With currency interventions, the SNB is trying to keep sectors alive, that would not survive without interventions.
At the same time, importers keep the currency gains of imported goods and return little to the consumer. This tendency is accentuated by the SNB, that makes the franc weaker.
Texts and Charts from the Swiss customs data release (translated from French).
Exports and Imports YoY DevelopmentIn the third quarter of 2019, foreign trade showed a positive trend: while exports rose by 0.9%, imports posted double growth (+ 1.8%). Both the first and the second have achieved a record quarterly result. The trade balance is closing with a surplus of 5.9 billion francs. In short: ▲ September alone brought exports to the 3rd quarter ▼ Asian imports exceed CHF 11 billion for the first time ▲ Exports: the downtrend of machinery and electronics as well as metals is confirmed |
Swiss exports and imports, seasonally adjusted (in bn CHF), Q3 2019(see more posts on Switzerland Exports, Switzerland Imports, )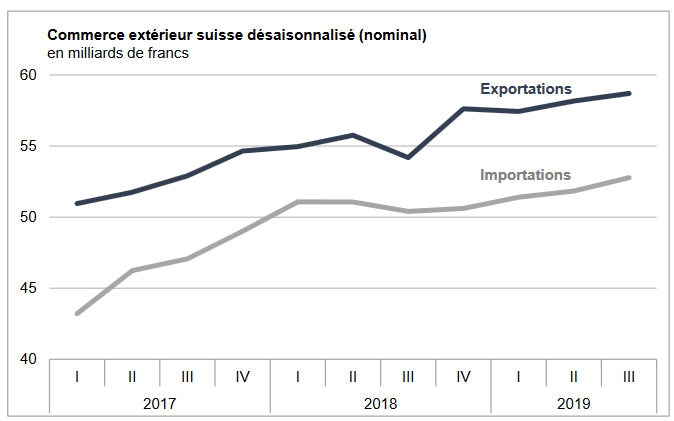 Source: newsd.admin.ch - Click to enlarge |
Overall EvolutionIn the third quarter of 2019, exports grew by 0.9% in seasonally adjusted terms (actual: -1.0%), to reach a record level of 58.7 billion francs. They confirm the positive trend since the end of 2018. At + 1.8% (real: + 0.5%), imports recorded a fourth consecutive quarterly increase and reached the record result of 52.8 billion francs. The surplus in the trade balance was 5.9 billion francs. |
Switzerland Trade Balance, September 2019(see more posts on Switzerland Trade Balance, )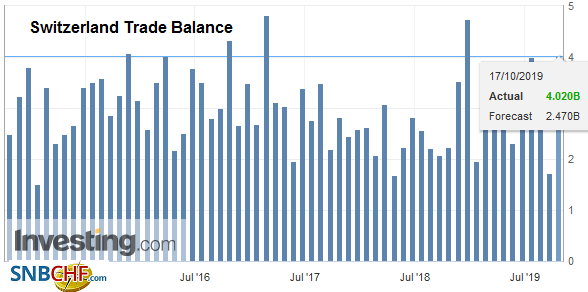 Source: investing.com - Click to enlarge |
ExportsNon-pharma exports down The growth of exports in Q3 2019 is due to the jump in chemicals and pharmaceuticals (+ 2.7%, + FF766 million). The paper sector and graphic arts products also increased, while the other major groups all declined. In pharmaceuticals, pharmaceuticals and active ingredients contributed the most to growth (respectively +605 and +258 million francs). With a second quarter in a row, chemicals and pharmaceuticals now face the 30 billion mark. The watchmaker stagnated over a quarter (+ 0.2%) and confirmed the slowdown posted since the end of 2018. Evolving in a negative spiral, the machinery and electronics sector (-3.0%) and metals (-2.4%) %) declined in Q3 2019. At -1.9%, precision instruments recorded a second decline in a row. Geographically, export growth gained ground in North America (USA: +330 million francs) and to a lesser extent in Asia. While sales have been rising in the North American continent since the beginning of the year, they are stagnating on the Asian continent. Europe has been on a positive wave since the end of 2018, despite a decline of 1.4% in the third quarter of 2019. In Asia, both the jump of Japan (+215 million) and the fall of Singapore (-164 million) have detonated. On the Old Continent, the English, German and Belgian markets together melted by 332 million francs. In contrast, Italy (+153 million) and Russia (+142 million, chemistry-pharma) have had the wind in their sails. |
Swiss Exports per Sector Q3 2019 vs. 2018(see more posts on Switzerland Exports, Switzerland Exports by Sector, )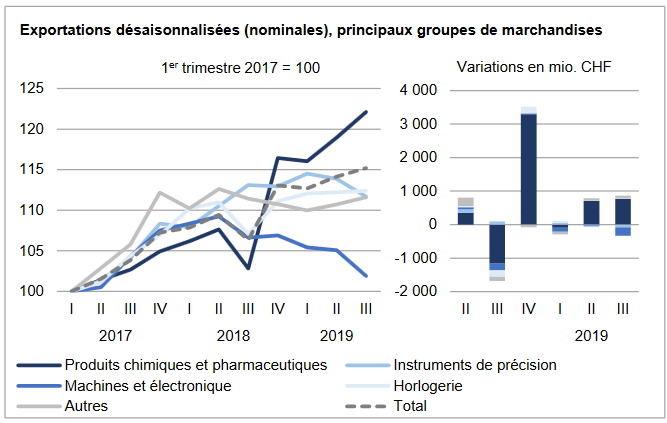 Source: newsd.admin.ch - Click to enlarge |
ImportsGold jewelery from the United Arab Emirates boosts imports In the third quarter of 2019, imports gained ground under the impetus of jewelery (+492 million francs, other goods group) and, to a lesser extent, vehicles (+235 million) and chemicals. and pharmaceuticals (+132 million). With the exception of vehicles, the other two sectors continued their momentum. The rise of medicines (+631 million) as well as raw materials and basic overcompensated the plunge of active ingredients (-565 million). Metal inputs (-295 million) and those of the machinery and electronics sector (-193 million) have unscrewed, the former confirming their downward trend and the seconds showing a flat trend. Geographically, the evolution of imports has been disparate. Asia continued its advance with double-digit growth (+ 10.8%). North America has been on a downward trend since early 2018, despite a 2.4% rise in the 3rd quarter of 2019. For its part, Europe fell by 1.5% and recorded a second consecutive decline. The Asian dynamism is explained by the surge in jewelry imports from the United Arab Emirates (+1.5 billion francs, gold jewelry for redesign). On the European continent, the cumulative decline of Ireland, France and Germany exceeded 1.2 billion francs. Meanwhile, the United Kingdom (+415 million francs) and Spain (+170 million) recorded their fourth consecutive increase. |
Swiss Imports per Sector Q3 2019 vs. 2018(see more posts on Switzerland Imports, Switzerland Imports by Sector, )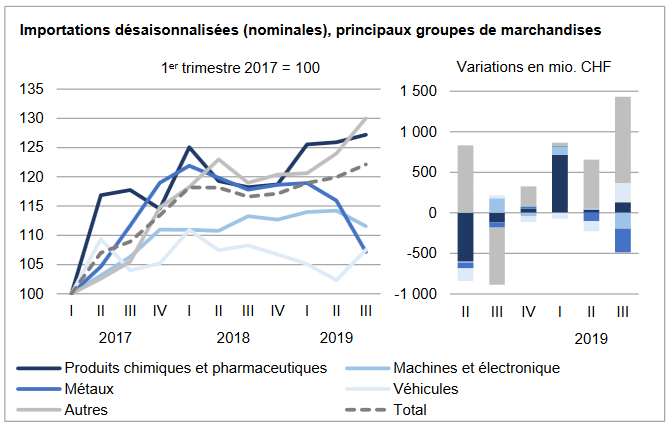 Source: news.admin.ch - Click to enlarge |
Tags: newsletter,Switzerland Exports,Switzerland Exports by Sector,Switzerland Imports,Switzerland Imports by Sector,Switzerland Trade Balance


