| As noted earlier this week, the world’s two big hopes for the global economy in the second half are pinned on the US labor market continuing to exert its purported strength and Chinese authorities stimulating out of every possible (monetary) opening. Incoming data, however, continues to point to the fallacies embedded within each. The US labor market is a foundation of non-inflationary sand, and China’s “stimulus” is proving again to be little more than ad hoc deflection of an enormous external drag/hole.
Today’s CPI release in the United States was yet another data point moving the wrong way for a second half rebound. In China, car sales are declining at an increasing rate. |
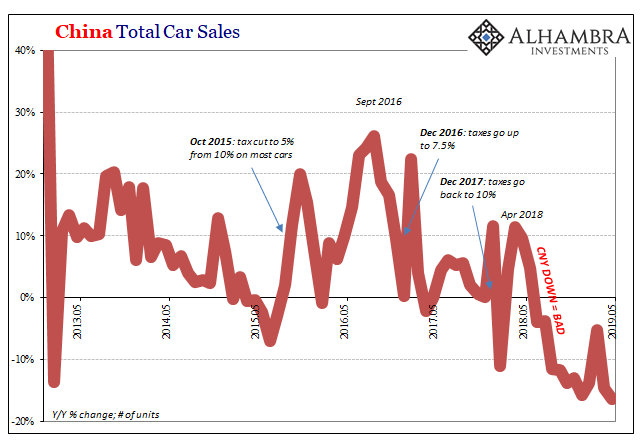
China Total Car Sales, 2013-2019 |
| According to the China Association of Automobile Manufacturers (CAAM), the total number of units sold fell by a record amount in May 2019. Year-over-year, the rate of contraction was a stunning -16.4%. It was also the eleventh straight month of minuses – meaning, importantly, this isn’t a new development.
That doesn’t mean, however, there won’t be excuses and benign-sounding explanations put forward at every opportunity. Recall that when German industry first plunged around last October, it was blamed at first on emissions regulations in the same auto sector. While German industry continues its steadfast contraction, Chinese observers including those at the CAAM seek to borrow the same theory at least for a little while.
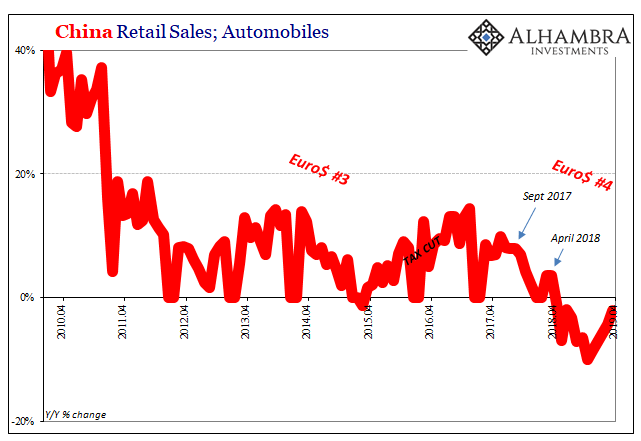
While regulations don’t (ever) help, the imposition is very likely only making what is already a bad situation worse. The key is in the timing; auto sales took off downward after last April. CNY DOWN = BAD. The big double-digit declines in car sales showed up right in September and October 2018. Rather than emissions, recall the PBOC’s coincident warning. What the CAAM figures for industry sales only matches the Chinese government’s on the wrong side of zero. The official retail sales estimates in this one industry have likewise been negative for the same span of time, meaning going back to last April, but the intensity of the minus signs has diverged from the other, private series. |
China Retail Sales; Automobiles, 2010-2019(see more posts on China Retail Sales, ) |
| The actual estimates in each series aren’t going to match perfectly, of course, but they generally follow along in the same ballpark. One exception on the high side was in the middle of 2016 when CAAM’s estimates were significantly better than the NBS numbers (the latter take into account prices, not just the total number of units).
It’s something to keep in mind as China reports retail sales estimates (along with IP and FAI) tomorrow. In other words, retail sales were horrible (for the Chinese) in April but weren’t materially worse because the NBS, unlike the CAAM, believes car sales came in at just -2.1% during that particular month (compared to nearly -15% in units according to private estimates). |
China Retail Sales; Automobiles, 2010-2019 |
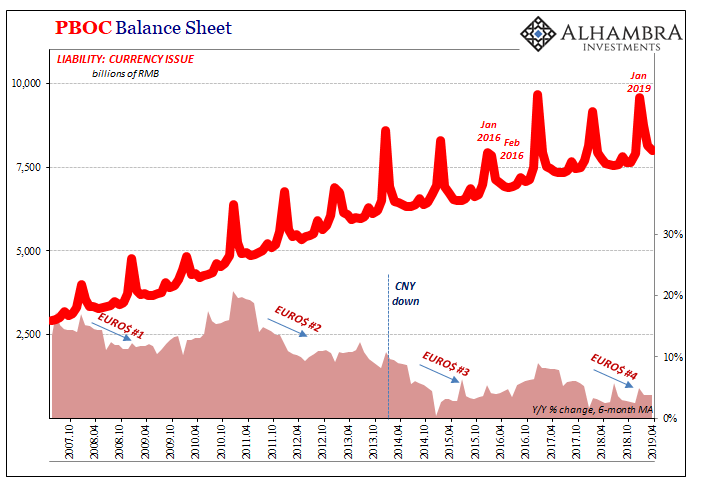
| Either way, it doesn’t impress much as far as the RRR “stimulus” is concerned. The first RRR was unleashed well over a year ago; meaning that the entire time, in whichever series, the auto industry in China has been contracting simultaneous to what the PBOC has been doing.
Like the US CPI or even recent payroll reports, there’s nothing in Chinese autos from which to base hopes for a second half rebound. Instead, just the same monetary consistency. |
PBOC Balance Sheet, 2007-2019 |
PBOC Balance Sheet, 2010-2019 |
Tags: $CNY,Auto Sales,China,China Retail Sales,EuroDollar,Markets,newsletter,PBOC,Retail sales,stimulus


