We have written numerous articles about capital consumption. Our monetary system has a falling interest rate, which causes both capital churn and conversion of one party’s wealth into another’s income. It also has too-low interest, which encourages borrowing to consume (which, as everyone knows, adds to Gross Domestic Product—GDP).
What Is Capital
At the same time, of course entrepreneurs are creating new capital. Keith wrote an article for Forbes, showing the incredible drop in wages from 1965 to 2011. There was not a revolution, because prices of goods such as milk dropped at nearly the same rate. The real price of milk dropped as much as it did, because of increased efficiency in production. The word for that which enables an increase in efficiency is capital.
Or, to put it another way, capital provides leverage for productive human effort. We don’t work any harder today, than they did in the ancient world (probably less hard). But we are much richer—we produce a lot more. The difference is capital. They had not accumulated much capital. So they were limited to brute labor, to a degree which we would find shocking today.
We have long had machine power to do most of the heavy lifting. For a few decades, we have had computers to perform much of the tedious number-crunching (you would be surprised how much number-crunching is involved in typing an article in a word processor). And computers also automate everything from manufacturing lines to business processes.
More recently, mobile computers and wireless networks have allowed us to efficiently organize markets, index a big fraction of everything ever published, and allocate resources such as cars to pick us up wherever we may be, and drop us off somewhere else.
Capital allows us to do more, with less. This principle applies to commodities as well as labor. A smart phone is a supercomputer, but it requires very little silicon and copper compared to the original generation. For example, the Cray-1 weighed over 5 tons and consumed 115kW. That’s over 30,000 times heavier than a Samsung Galaxy S9, and over 200,000 times as much power consumption. And for comparison, the S9 can perform over 4,500 times as many calculations per second.
Dairy production underwent a similar (if smaller) revolution. More cows could be supported on the same land, with more milk from each cow, and less labor per cow. This is all thanks to better breeding, computer tracking, customized individual feed control, and even automated rotating milk stations in the barn.
The Race
We have just described what computer software developers would call a race condition. Two processes—capital destruction and capital creation—are both running in the economy. The outcome of a race conditions will either be great, or terrible, depending on which process is faster. There is method to our madness, in formulating it this way. We will get to that below.
We want to first observe another problem with GDP. Who cares about the overall size of the economy? It’s not the gross size that matters to anyone. Of what benefit is it, to know that aggregate size is up 10%? What if population is up 11%? It could mean that each person is slightly worse off than before—but there are more people. And folks, it is by such low-resolution pictures that central planners attempt to perform their magic.
Once again, we see the breakdown of a macroeconomic statistic. It does not even tell us what it nominally (pun intended) promises. And it is useless as a planning tool anyways.
So how would one look at economic growth? And, to get back to our theme, how would one measure whether capital creation or capital destruction is winning?
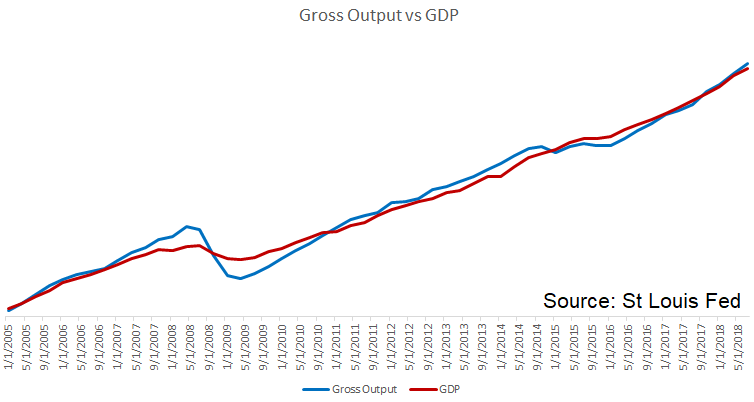
The Problem with GDPA naïve first attempt might be to divide GDP by population. “There, that addresses Keith’s complaint that population growth could mask a per-capita decline.” Maybe, but we cannot just assume a Quantity Theory of Economic Activity. Eating the seed corn does indeed add to GDP. Borrowing to consume, borrowing to finance ultimately unproductive assets adds to GDP. At least for a time. We could also partially address the concern that GDP overstates consumption, by using a relatively new measure called Gross Output. Proposed by economist Mark Skousen, Gross Output is a broader measure that also includes sales of goods which are used as inputs by other industries. Here is a graph showing GDP and Gross Output. As Gross Output is considerably greater than GDP, we have scaled them to fill the vertical space in the graph. |
Gross Output vs GDP 2005-2018 |
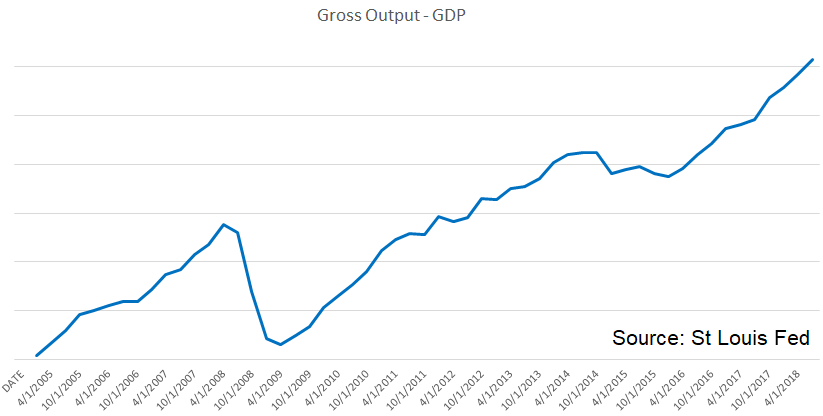
| It looks a lot like GDP, with more volatility (which Skousen acknowledges). Therefore, for our purposes—measuring true economic growth without distortion from malinvestment—it is not helpful. Perhaps someone would study the spread of Gross Output – GDP. A cursory look (below) shows it to be generally growing, except for a big dip around the global financial crisis, and a smaller dip around 2015.
We have not given it a great deal of thought, but if we had to guess we would assume that this is showing another view of the long-term falling interest rate trend. That is, lower interest rates stimulate investment in higher-order goods, which are intermediate goods used to produce consumer goods. Or goods used to produce goods which are used to produce goods which produce consumer goods, etc. If a business does not want to borrow at 10%, it may be tempted by 9%, 8%, or 7%. And when it borrows, it buys the sorts of goods that are included in Gross Output but excluded from GDP. Anyways, to look at true economic growth, stripped of the faux growth fueled by dirt cheap credit made dirtier-cheaper by ongoing central bank policy, we need another approach. This will help us answer the question of whether creation or destruction is winning. Carl Menger (the founder of the Austrian School) taught us to look for change at the margin. |
Gross Output - GDP 2005-2018 |
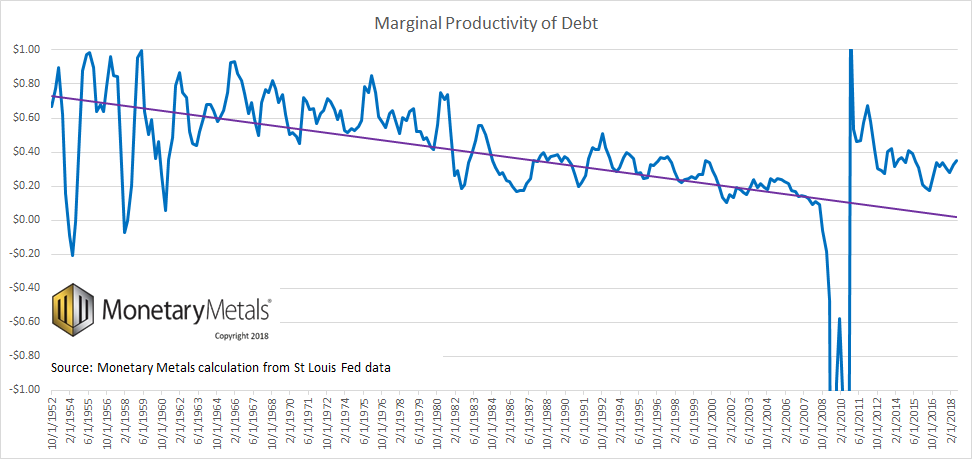
Marginal Productivity of DebtChange in what, that is the key question. Keith has proposed Marginal Productivity of Debt. This does not look at gross economic activity. Nor does it divide it by population. Nor even debt. It looks at the marginal increase of GDP (we could use Gross Output, but GDP data is available for many more decades), compared to marginal increase in (total, not just government) debt. How much additional economic activity does a newly borrowed dollar buy? Here is the graph. What is this graph telling us? Yes, the slope is down and it is a very long-term trend. We mean our question in the context of economic growth, and the race between capital creation and capital destruction. It is directly saying that we get less and less economic activity juice for every newly-borrowed dollar of debt squeeze. This is alarming, and we’ve written about it before. But today, we have another focus. This grow shows the results of the race. Alas, capital creation is losing. To understand why, we need to introduce a new concept. Which we will do next week. |
Marginal Productivity of Debt 1952-2018 |
Supply and Demand Fundamentals
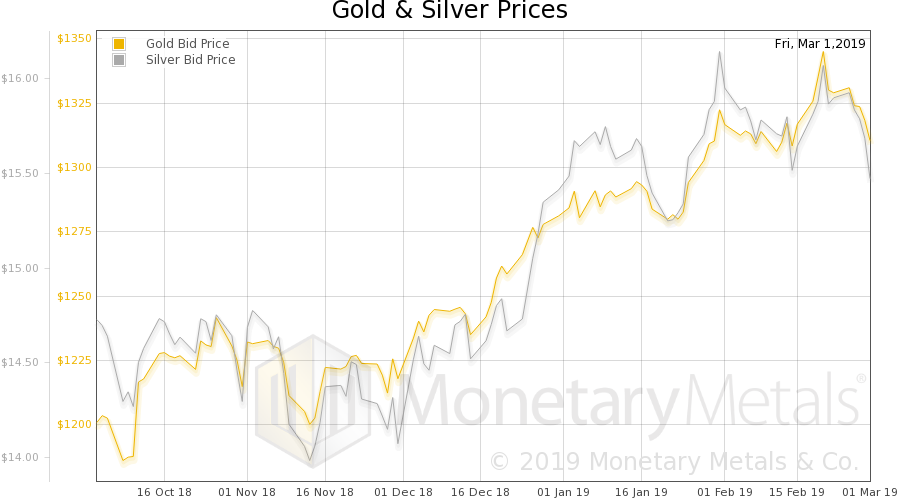
The prices of gold and silver fell $35 and ¢70, respectively. But what does that mean (other than woe unto anyone who owned silver futures with leverage)?
The S&P 500 index and the euro was up a bit, though the yuan was flat and copper was down. Most notably, the spread between Treasury and junk yields fell. If the central banks can lower the risk of default premium, they can make everything unicorns and rainbows again extend the aging boom a while longer.
The Bank for International Settlements defines a zombie corporation as one that’s been around for at least 10 years, and which has an interest coverage ratio less than one for three years in a row. In other words, mature firms with profits < interest expense.
As of 2016, zombies were over 12% of all public nonfinancial firms.
The central planners think to get GDP to go up. Well, zombie firms certainly consume, so keeping them alive would seem to support this goal. Plus they employ people. Wall Street certainly does not object. Partisans of whichever party has sent its leader to the White House also want rising GDP.
So the Fed finds ways to keep zombies alive.
Since zombies exist only by the grace of ever-lower interest rates, and ever-more-promiscuous credit conditions, the central bank must find a way to lower rates and push investors out on the risk curve.
They succeeded this week. Short-term interest rates were down. Rates on junk bonds fell also. But Treasury yields and AAA corporate bond yields were up. Oh well, you can’t have it all.
Actually, the absolute level is not the only thing that matters. The spread between junk and AAA or Treasurys also matters. This is a measure of stress at the margin, and also the penalty that junk firms must pay compared to competing firms.
One of the perennial criticisms of the Austrian School is that we don’t offer a precise prediction of timing (and a number of folks have tried to predict timing and have been wrong). We think this criticism misses the point.
If a process is destructive of firms, there is value in identifying it clearly, of shining a spotlight on it, of bellowing from the rooftops. Sure, it would be good to be able to say, “June 4 at 11:22AM is when it will begin.” But absent that kind of precise timing, we can still be sure that a destructive process is ongoing.
And the response, “but rising GDP,” is no response to this allegation.
We also think that the Fed is in a pickle. To keep the zombies adequately fed—with the blood of the savers, it can never be said too often—it has to lower rates. However, what conventional theory can justify this? We have heard some noise, faint so far, that there’s no inflation so therefore they have more latitude, etc. And we are not even talking about the so-called modern monetary theory now being pushed from the Left.
Of course there’s scant signs of rising prices (other than where tax and regulation force up retail prices). Lower rates means hamburger chains can borrow more to open up more hamburger restaurants. Manufacturers of kitchen equipment can borrow more to expand production of hamburger grills. The result is greater supply of burgers, soft prices, and falling profit margins. Not inflation.
We saw a discussion amongst Austrian economists recently about whether or not one should own gold. Yes, gold is not an investment. So, why own it?
If the Fed has driven the risk yield of all investments down, where is your line? Where do you choose not to be invested?
We have said many times that the Fed cares not about the price of gold. Its officials would have no reason to incur career risk (or prison time) to manipulate the price, even if they had the means. But here is one area where they care about, not price of gold per se, but attractiveness of investment.
If investors expect flat to negative returns, then they must turn to gold as the only alternative. If you cannot get return on capital, then you at least want return of capital. This is not what the Fed wants, what Wall Street wants, what Warren Buffet wants, or what most investors want. It’s a scenario where few firms make money, many lose money, and increasing numbers at the margin go under. And few investors stay even.
It will be a scenario like 2008, when it comes.
We have a tool to help predict it: the gold basis. Is it a good thing, or a bad thing, that our indicator is not now flashing red alert?
Gold and Silver PriceLet’s look at the only true picture of the supply and demand fundamentals of gold and silver. But, first, here is the chart of the prices of gold and silver. |
Gold and Silver Price(see more posts on gold price, silver price, ) |
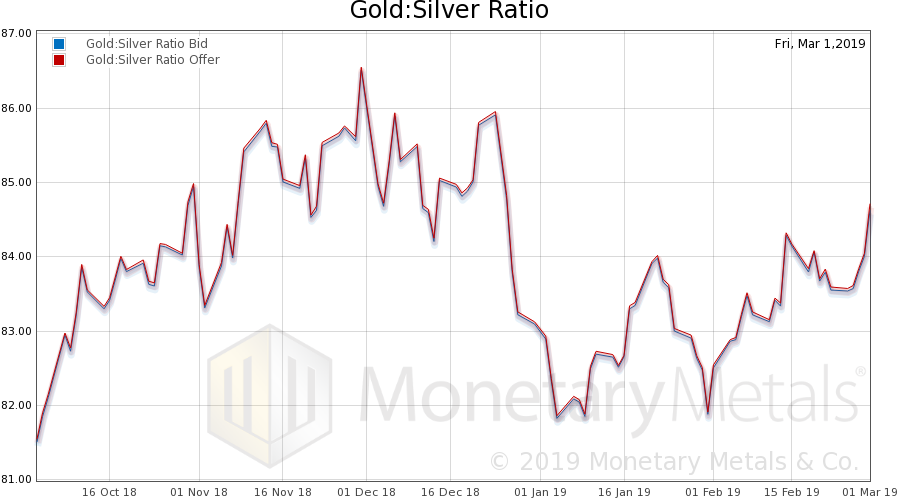
Gold:Silver RatioNext, this is a graph of the gold price measured in silver, otherwise known as the gold to silver ratio (see here for an explanation of bid and offer prices for the ratio). It was up a point and a half this week. |
Gold:Silver Ratio |
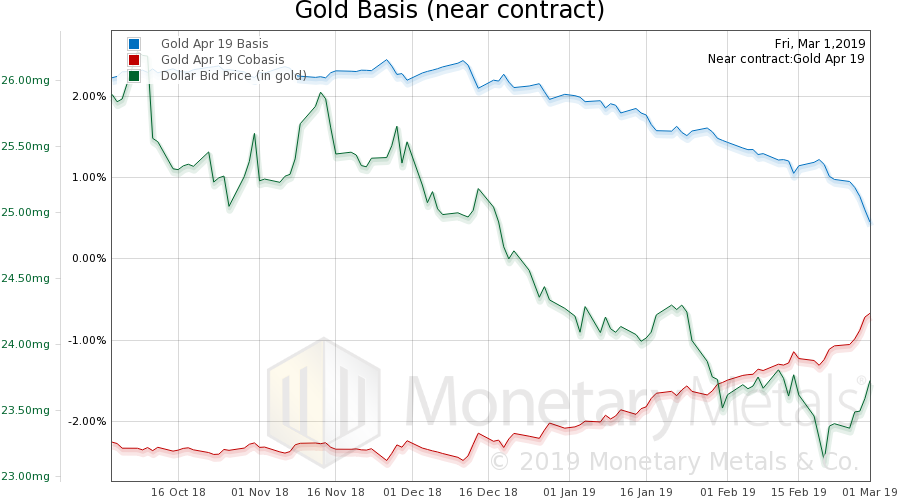
Gold Basis and Co-basis and the Dollar PriceHere is the gold graph showing gold basis, cobasis and the price of the dollar in terms of gold price. Well, we broke a month long streak of rising gold prices. This week (actually starting midweek last week), the price of gold began falling. Along with this, we see a big rise in the scarcity of the metal (i.e. cobasis), at least in the April contract. The gold basis continuous is up only slightly). This shows a selloff of both metal and futures. The Monetary Metals Gold Fundamental Price is up marginally, to $1,421. |
Gold Basis and Co-basis and the Dollar Price(see more posts on dollar price, gold basis, Gold co-basis, ) |
Silver Basis and Co-basis and the Dollar PriceNow let’s look at silver. The price of silver dropped by a much greater percentage (we can see the dollar rose from 1.93g silver to 2.01 grams). And we see a big rise in the cobasis along with the price move. But as with gold, the silver basis continuous shows no real move. Still, the Monetary Metals Silver Fundamental Price is down ¢29 to $16.16. |
Silver Basis and Co-basis and the Dollar Price(see more posts on dollar price, silver basis, Silver co-basis, ) |
© 2019 Monetary Metals
Full story here Are you the author? Previous post See more for Next postTags: Basic Reports,capital consumption,capital destruction,Central Bank,central planning,dollar price,GDP,gold basis,Gold co-basis,gold price,newsletter,silver basis,Silver co-basis,silver price,the fed


