Joseph Y. Calhoun
My articles My siteAbout meMy videosMy books
Follow on:LinkedINTwitterSeeking AlphaAmazon
A Return To Normalcy
In the first two years after a newly elected President takes office he enacts a major tax cut that primarily benefits the wealthy and significantly raises tariffs on imports. His foreign policy is erratic but generally pulls the country back from foreign commitments. He also works to reduce immigration and roll back regulations enacted by his predecessor. This President is widely rumored to have had numerous adulterous affairs and his administration is wracked by repeated scandals. He often seems overwhelmed by the job of President and confides to friends that he wasn’t prepared for the job.
President Trump? No, that describes the Presidency of Warren G. Harding. It only got worse after he died of a heart attack in the third year of his term and the Tea Pot Dome scandal came to light. He never faced impeachment himself but his attorney general survived several impeachment votes and two indictments before being forced to resign during the Coolidge administration. Harding is regularly rated as one of our worst presidents. His successor, Calvin Coolidge, is widely held to be the most boring president of all time, earning him the nickname Silent Cal. I would be remiss if I didn’t also point out that Coolidge bears more than a passing resemblance to Mike Pence, another man in no danger of being accused of verbosity.
Given the recent turmoil, I think we’d all be thankful for a little boring out of our government right now. But President Trump shows no sign of giving in on his border wall and the Democratic leadership appears to be following Napoleon’s maxim to never interfere with your opponent when he is in the process of destroying himself. But eventually we will achieve Harding’s campaign slogan and return to normal or at least what passes for that in the Trump era.
I often see comments about how something happening today is “unprecedented” but I rarely find that statement to be true. It is usually a case of the speaker (or writer) not knowing history which is replete with examples of just about any situation you can imagine. The examples may not be exact or as eerie as the Harding/Trump analog but to paraphrase Mark Twain, one can usually find examples that rhyme with the present.
And so, unlike most others in this business, I don’t see today’s economic environment as being all that special. Yes, we had a number of years of extraordinary monetary policy but that is hardly the first time and surely won’t be the last. The US used QE during and after WWII until the Fed/Treasury accord of 1951 and the Bank of Japan used it in 2001. Forward guidance? I think Paul Volcker was the first Fed Chairman to signal policy in advance but I bet there are earlier examples. Recent monetary policies may be ones rarely used but they are hardly unprecedented. We recovered from them in the past and we’ll recover this time too.
The Fed has raised rates steadily over the last two years and has now reached a level that many believe threatens to push the economy into recession. That is of course always possible but right now the market based indicators we monitor do not support the recession scenario. It appears to me, based on the available information, that what we’ve just witnessed is markets pricing in a return to normalcy – or at least the “new normal” that has prevailed in recent years. The spurt of growth we got from tax cuts and the anticipation of tariffs was not sustainable.
After a couple of quarters of above trend growth, the US economy is falling back to the previous trend. Will that slowing proceed to recession? I don’t know the answer to that but an economy growing around a 2% average is always going to be more vulnerable to a negative shock of some kind than one growing at 3% or 3.5%. If we get such a shock we could easily fall into recession. But that has been true for most of the period since 2009 and the economy keeps chugging along. We came close in 2015/16 when growth fell to nearly zero but the shale bust wasn’t enough to tip the scales.
Today’s weak spots are housing and once again shale but for now neither appears sufficient to pull the economy down into contraction. Housing just isn’t as large a part of the economy as it has been in the past. Residential investment spent most of the 80s and 90s between 4 and 5% of GDP before spiking to nearly 6% at the peak of the housing bubble. It fell to 2.5% in the aftermath and has only recovered to just over 3% today. If housing investment falls back to the lows it will certainly slow GDP growth but probably not enough to cause a recession.
As for the shale industry, drilling activity is slowing with crude prices in the low $50s. But it doesn’t appear to be causing the same level of stress it did when prices fell from over $100 to $35 from 2014 – 2016. A lot of the weaker companies failed during that bust and the ones that survived were better prepared this time with most of their production hedged at profitable levels. Of course, that only matters for oil they are already producing. The same level of drilling activity is unlikely at current prices and that has been a not insignificant part of investment – and growth – in recent years. So, again, a slowdown but probably not that severe. Credit markets support that view as you’ll see below.
Economic growth is a function of workforce growth and productivity. We can either put more people to work and raise output or we can raise output by making the existing workforce more productive. The latter – increasing productivity – is the key to raising living standards. With population growth stalling and the current administration hostile to immigration, raising productivity is critical to future growth. And that requires investment.
Investment in this cycle has been slow to recover and today Gross Private Domestic Investment stands at about 18% of GDP. That is still well below the peaks we’ve seen in previous cycles of around 20%. Could we get there before this cycle ends? Sure. Will we? I don’t know obviously but absent a shock of some kind I don’t see why not. A return to normalcy – if that is what we ultimately achieve – means this cycle may have quite a bit more to go.
One warning though. The negative impact of the administration’s trade policies may be the shock that puts an end to this expansion. I think a resolution of some kind of the trade war with China makes sense for both sides. But I have no idea – and I don’t think anyone does – what President Trump will do next. Forget monetary policy. It’s trade policy that matters the most and where the greatest risks lie.
Economic ReportsNote: Several of the economic reports we track in these updates have not been reported due to the government shutdown. Economic Growth & InvestmentIndustrial production was negatively impacted by unusually warm weather in December which pushed utility output down 6.3%. Overall it isn’t growing as fast as I’d like but it is moving in the right direction. Personal income was up less than expected and just 4.2% year over year which is just so-so compared to history. With consumption rising faster the savings rate is falling. Existing home sales were awful last month, something being blamed on rising mortgage rates. Maybe, but it also has something to do with that so-so income growth and rising prices. The most important indicator in this section as always is the CFNAI which is a weighted average of 85 separate indicators. In November the CFNAI came in at 0.22 a bit better than expected. Unfortunately, October was revised lower to 0.0 indicating an economy growing at trend. The three month moving average is now 0.12, a level that indicates the economy is growing slightly above trend. The CFNAI confirms what I’ve been writing in these reports for some time – the economy’s growth path hasn’t changed much and the spurt of above average growth in Q2 and Q3 was the anomaly. |
Economic Growth & Investment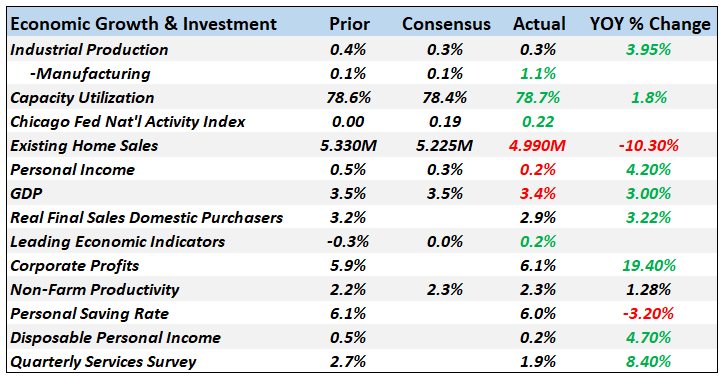 - Click to enlarge |
ProductionMost of these regional and national surveys are also moderating, further confirming that growth is returning to trend. KC and Dallas, by the way, are indicative of what is going on in the shale patch. |
Production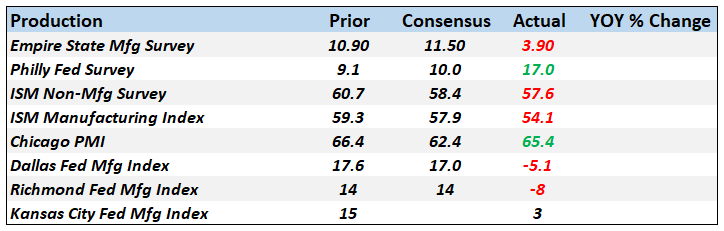 - Click to enlarge |
Consumption & DistributionWe haven’t gotten the retail sales report yet but based on reports from retailers it probably won’t be very good. The consumer spending report was for November so doesn’t tell us much about how shoppers responded to the market turmoil in December. |
Consumption & Distribution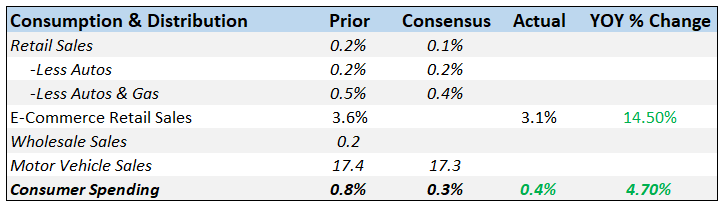 - Click to enlarge |
InventoriesWe haven’t received up to date reports on inventories but they have been rising for some time and I don’t think that changed. Much of that is due to the front running of potential tariff hikes but some is likely unintentional as well. |
Inventories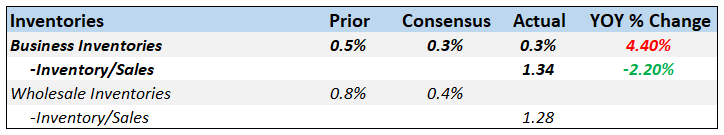 - Click to enlarge |
OrdersThe durable goods report for December was uniformly ugly and the capital goods portion especially so. One bright spot was that November capital goods orders were revised significantly higher. The trend for durables is still up but the rate of change is definitely falling. |
Orders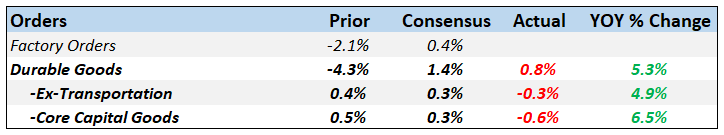 - Click to enlarge |
TradeWe do not have up to date information on trade. |
Trade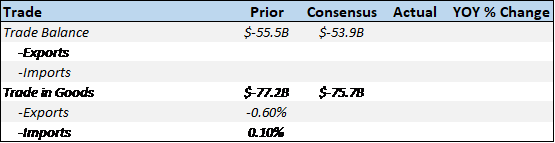 - Click to enlarge |
InflationHouse price inflation is moderating but prices are still rising. With the drop in existing home sales that may not last. Goods inflation doesn’t seem to be a problem right now and gives the Fed room to pause. |
Inflation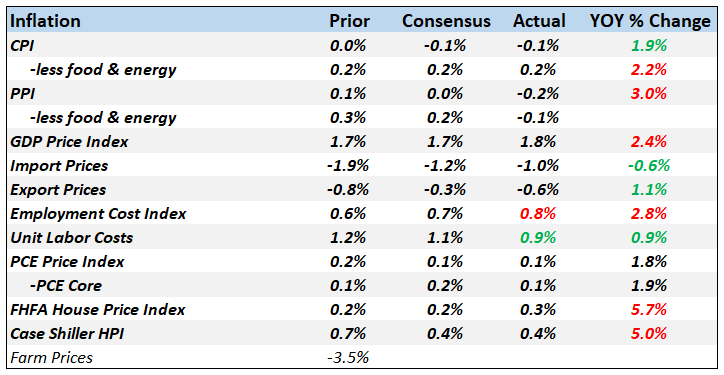 - Click to enlarge |
EmploymentThe employment picture remains fairly robust but the quits rate in the JOLTS report did show a decline. In addition, Challenger Job Cuts were up 35% in 2018. Average hourly earnings ticked higher in the regular employment report but the rate of change is still fairly low. |
Employment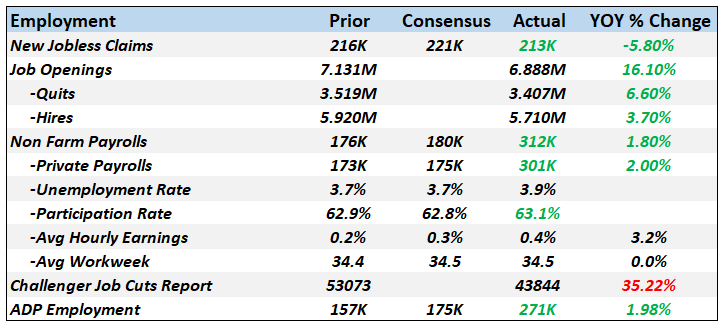 - Click to enlarge |
ConstructionNot a lot of new data on construction but we know what the trend has been – down. That probably didn’t change in December. |
Construction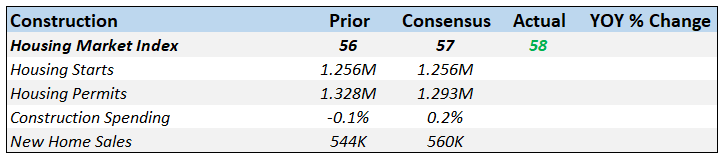 - Click to enlarge |
SentimentMeasures of sentiment are generally moderating. That is probably due to the market, the mid-term elections and the trade uncertainty. |
Other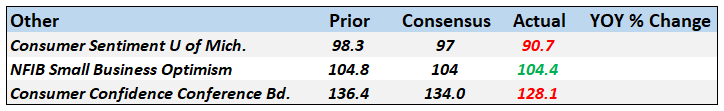 - Click to enlarge |
Market Indicators10-Year Treasury Note YieldThe 10 year Treasury yield hit its nadir right at the turn of the new year. We took profits on some of our longer duration positions on January 7th right near the bottom. The rebound is mostly tied to a rebound in oil prices and a minor recovery in inflation expectations (see below). |
10-Year US Treasury Yield Index 2019(see more posts on US Treasury, )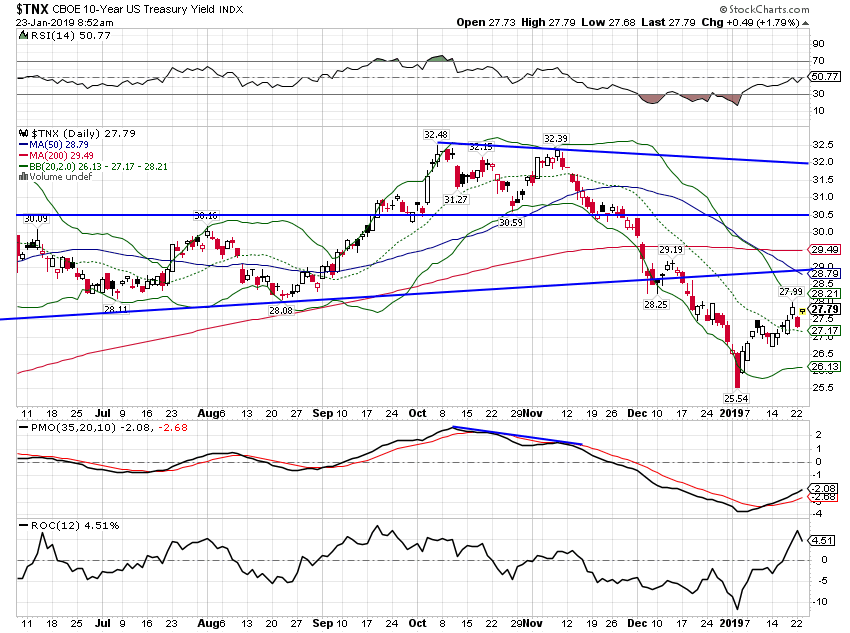 - Click to enlarge |
| Further rise in rates will depend on several factors including the direction of the dollar. Right now, unless the dollar suddenly falls out of bed, I wouldn’t expect this rally in rates to last long or carry far. |
10-Year Breakeven Inflation Rate 2014-2019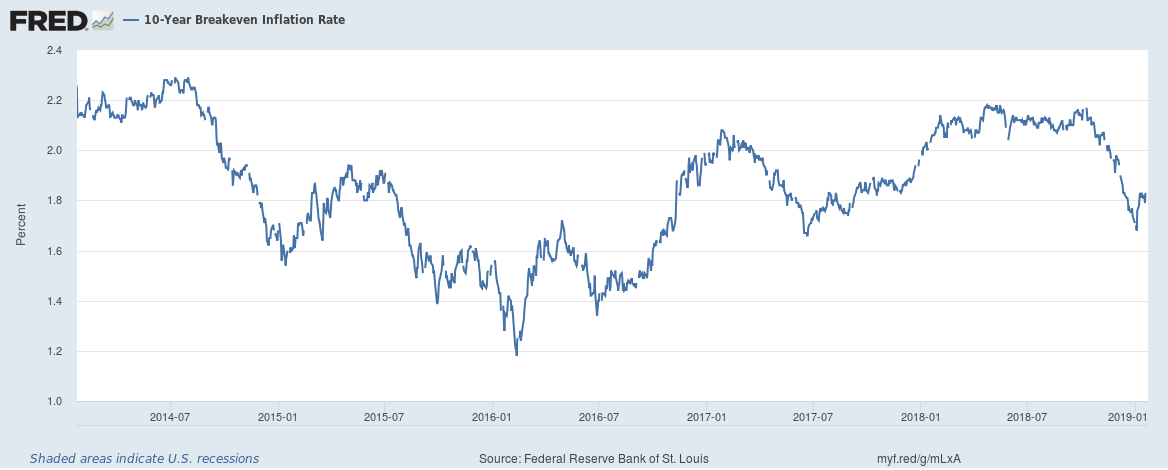 - Click to enlarge |
10-Year TIPS YieldReal rates have pulled back some but real growth expectations are, perhaps, surprisingly steady. The rally in the nominal 10 year was driven mostly by a drop in inflation expectations. |
10-Year Treasury Inflation-Indexed Security 2014-2019 - Click to enlarge |
2-Year Treasury Yield2 year Treasury yields have also recovered from their lows of December but more work will be required to say this is back in an uptrend. It may be that this is as good as it gets and rates are plateauing for this cycle. I’d be a bit surprised if that turns out to be true but not much. The 90 day bill rate has also stopped rising, a reflection of monetary policy expectations. The market believes the Fed is on hold. |
2 Year US Treasury Yield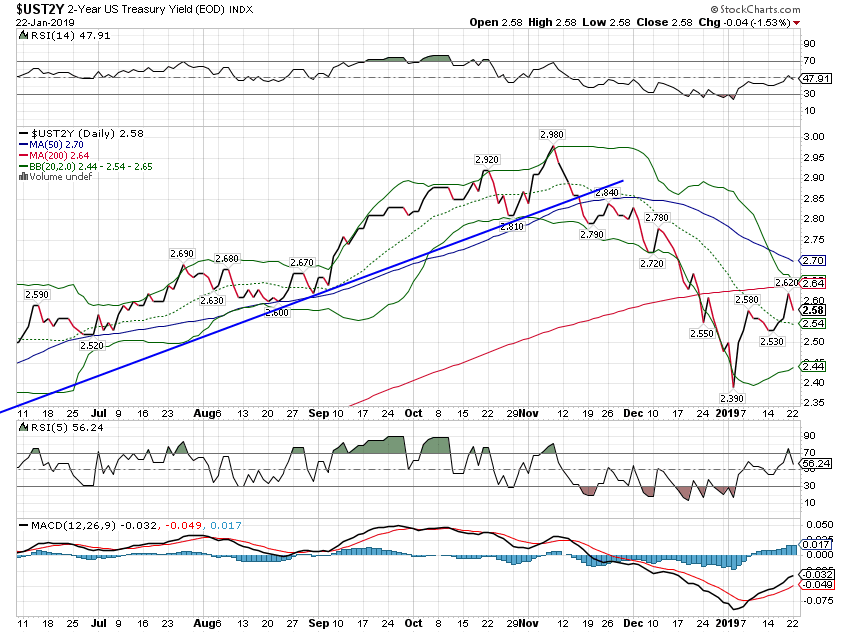 - Click to enlarge |
10/2 Yield CurveThe yield curve has flattened a little since the beginning of the year and the trend is still down. The minor steepening we had in December was a bit worrisome but not rapid enough to worry about recession. If the market starts to price in a Fed rate cut, I’ll probably go on high alert but we aren’t there yet. |
Yield Curve - 2 Year Bonds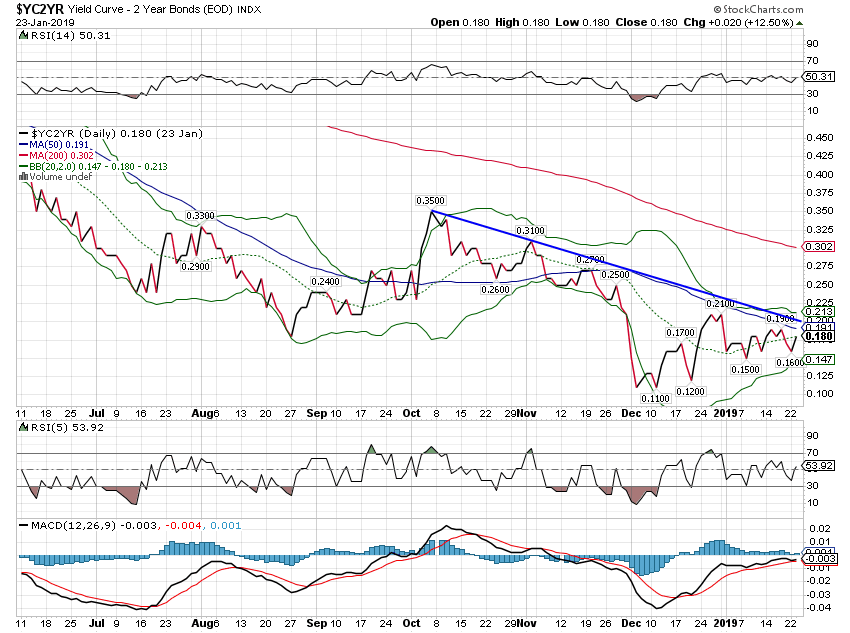 - Click to enlarge |
Credit SpreadsCredit spreads widened in the fourth quarter by about 200 basis points versus nearly 600 basis points in the previous episode a couple of years back. And spreads have already recovered 100 basis points of that move just since the turn of the new year. Credit markets are not worried about the shale patch this time around and the widening hasn’t really moved beyond the oil patch. |
ICE BofAML US High Yield Master II Option-Adjusted Spread 2014-2019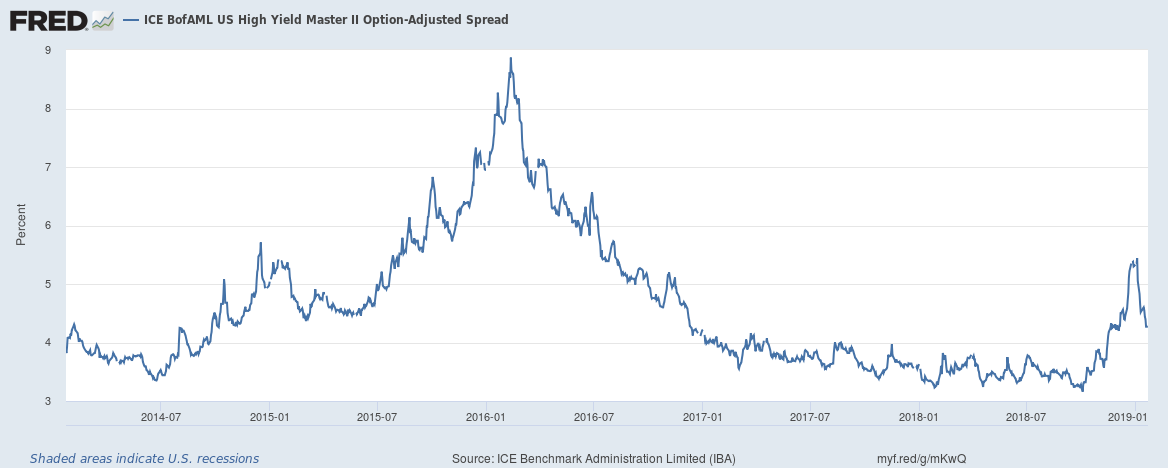 - Click to enlarge |
US DollarThe dollar looked like it was finally going to get in a downtrend but it bounced off the lows and is back to flat for the year. Still, there are plenty of dollar longs out there and the contrarian position is still with the bears. With Europe still looking worse than the US though the dollar will probably mark time at least. The Yen caught some bids during December but that was temporary. One currency to keep an eye on is the British pound which will react to the Brexit drama. I suspect long pounds might be a good trade this year not matter how that comes out. |
US Dollar Index Monthly 2019(see more posts on US Dollar Index, )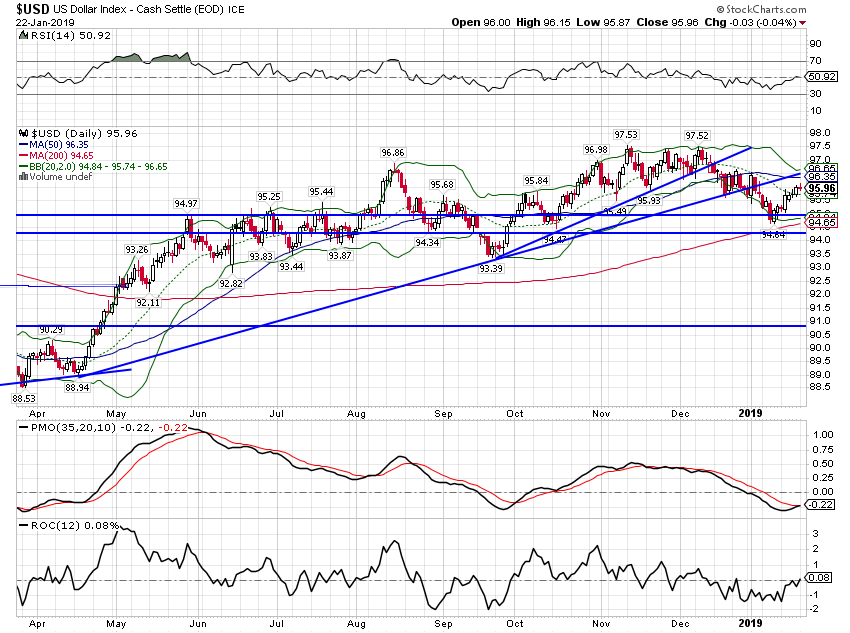 - Click to enlarge |
CommoditiesGold has pulled back with the rally in the dollar after hitting $1300 right after the new year. The trend here is up for now but more upside is probably dependent on the dollar resuming a downtrend. We rebalanced the commodity portion of our portfolios after the new year to take some profits on our gold position and add to the general commodity indexes. |
Gold monthly 2019 - Click to enlarge |
| Crude has bounced off the lows but I wouldn’t expect to see a sustained uptrend any time soon. Again, probably depends on the dollar. |
Light Crude Oil 2017-2019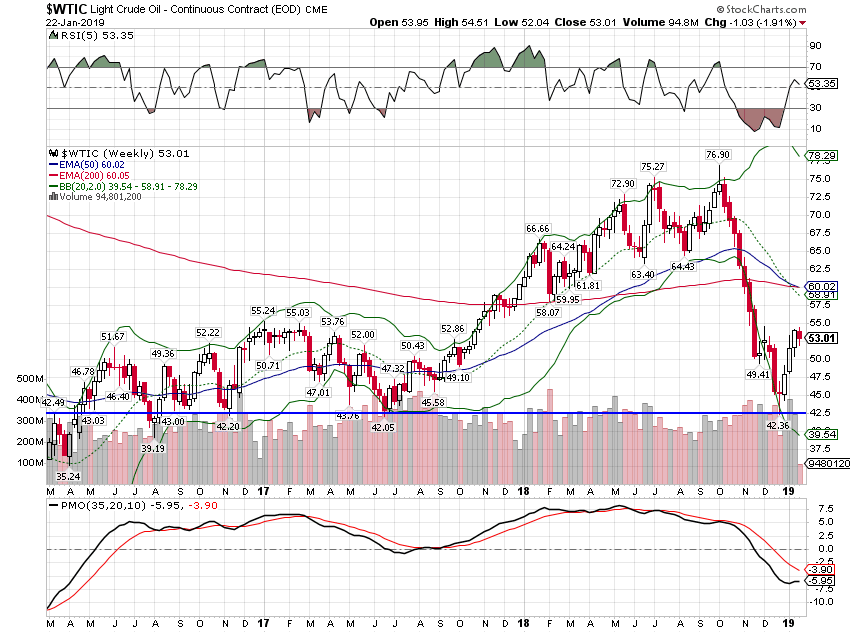 - Click to enlarge |
| The general commodity indexes recovered with crude oil. I continue to believe that we are in a longer term transition from strong dollar to weak dollar that will favor commodities and foreign assets. Commodities made their bottom a couple of years ago but the transition will take more time. |
S&P GSCI Commodity Index 2017-2019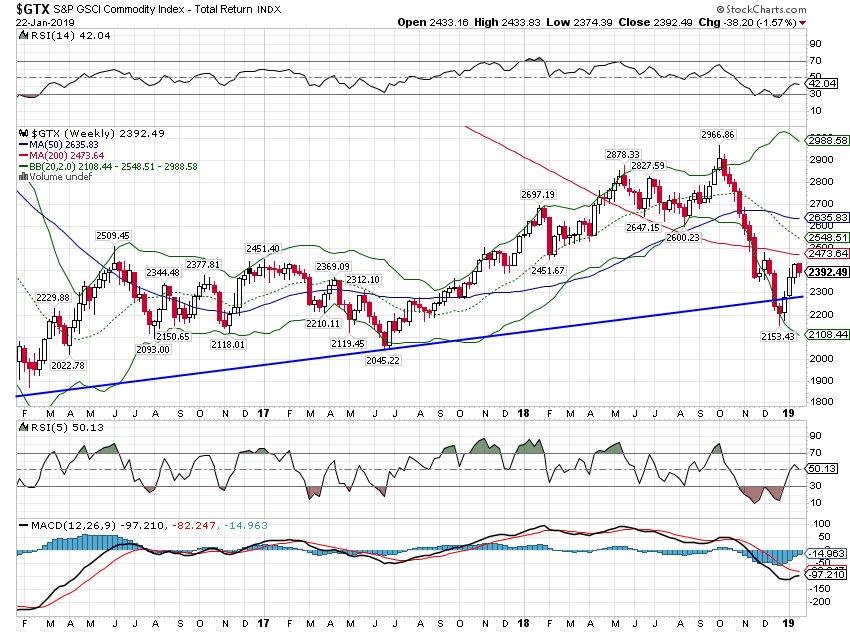 - Click to enlarge |
| The Bloomberg commodity index isn’t as energy heavy as the GSCI so it hasn’t recovered as much. |
Bloomberg Commodity Index 2016-2019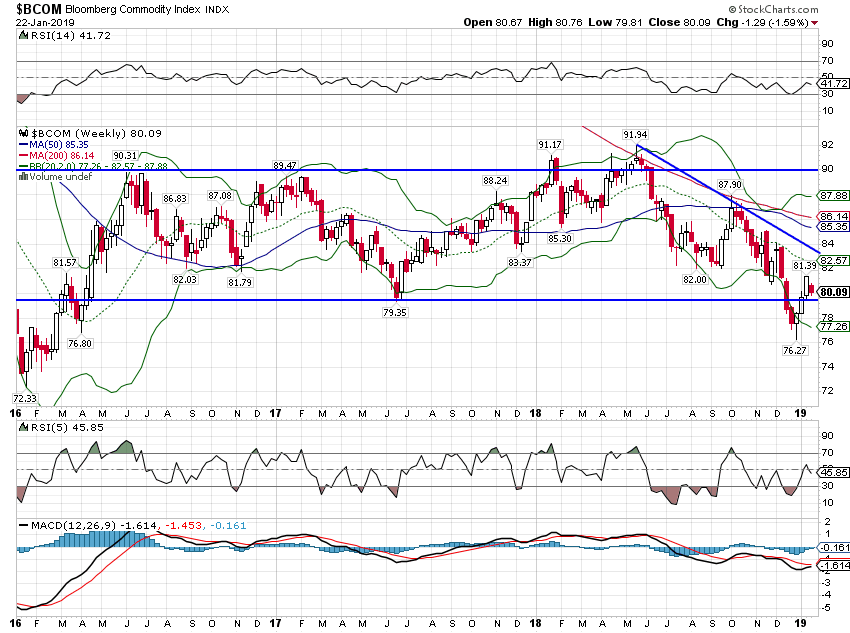 - Click to enlarge |
| The long term copper:gold ratio still points to lower rates but the trend is aged. The economic data would have to deteriorate significantly from here to push us back to those 2016 lows. That could happen but for now I don’t see a reason to expect it.
There seems to be a lot of fear out there that a recession is imminent. The data and markets just don’t support that right now. Rather than expect the thing that happens infrequently – a recession – I think it makes more sense to see this as a slowdown that returns growth to the previous trend. You might call it a return to the new normalcy. |
Copper/Gold 2017-2019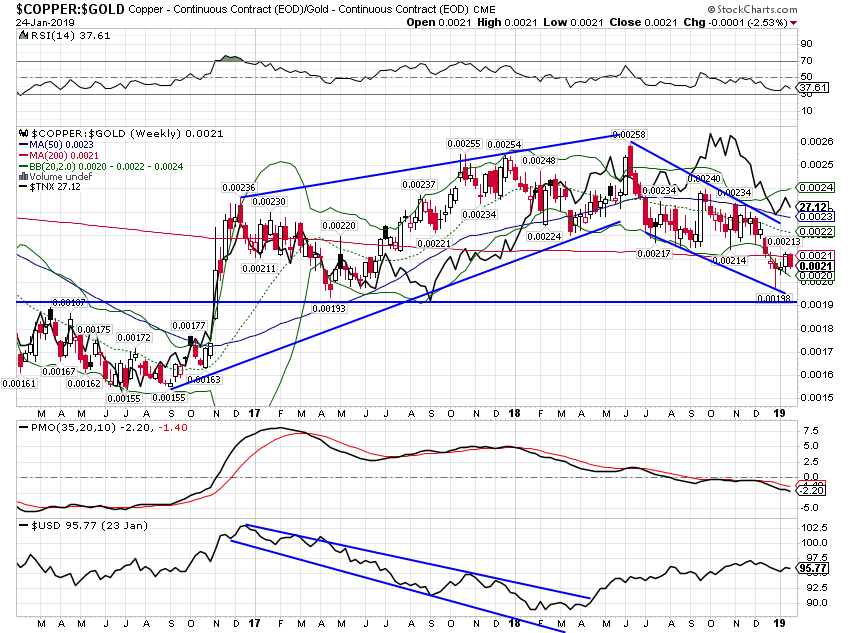 - Click to enlarge |
Tags: Alhambra Research,Bonds,commodities,credit spreads,currencies,Donald Trump,economic growth,economy,Federal Reserve/Monetary Policy,Gold,inflation,Interest rates,Monthly Macro Monitor,newsletter,Politics,TIPS,US dollar,US Dollar Index,US Treasury,Yield Curve