


Precious Metals PatternsPrices in financial and commodity markets exhibit seasonal trends. We have for example shown you how stocks of pharmaceutical companies tend to rise in winter due to higher demand, or the end-of-year rally phenomenon (last issue), which can be observed almost every year. Gold, silver, platinum and palladium are subject to seasonal trends as well. |
 Although gold and silver are generally perceived to trend in the same direction, there are actually big differences in their seasonal trends [PT] |
Seasonal Analysis with our Web AppWe have used our Web App (app.seasonax.com) to show you the seasonal trends in prices for precious metals. The chart below depicts the seasonal pattern of the gold price. It shows prices over a specific time period, in the form of the average performance of prices over many years in the course of one calendar year. Gold Price in USD, seasonal trend over 34 years Gold prices tend to exhibit a seasonal rally in the second half of the year, with the bulk of the advance beginning in early August. Looking at the following year, one can observe that the rally continues throughout January. The area with the slightly darker blue background highlights the positive seasonal trend in the chart above. |
Gold Price, 1 year(see more posts on gold price, )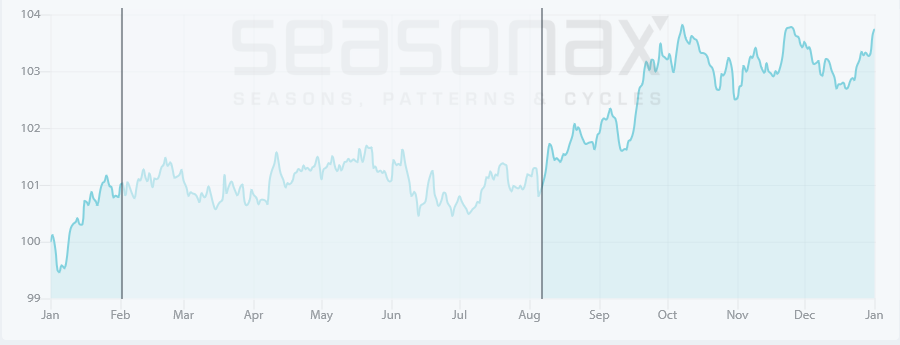 The price of gold typically rises from early August until February - Click to enlarge |
The Gold Price has Increased 23 out of 33 Times in the Positive Seasonal Time PeriodThe positive seasonal period between August 7 and February 1 of the following year has been characterized by rising gold prices in 23 out of 33 cases. The average profit in rising years was 8.87%, while losses averaging 5.22% were posted in declining years. The bar chart below depicts gold price returns over the positive seasonal time period for every year since 1971. Years in which gains were recorded are represented by blue bars, years in which losses were recorded by red bars. It can be clearly seen that gold tends to rise more often than decline in this time period and that the advances are stronger than the declines – the green bars depicting positive returns are both more frequent and larger than the red bars. It is also evident that even this positive seasonal time period for gold failed to generate large returns between 1980 and the late 1990s – which is not surprising, as the gold price was mired in a large-scale bear market over these years. |
Gold Price 1985-2017(see more posts on gold price, )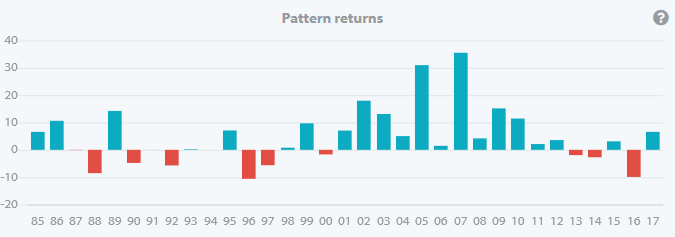 Gains (blue) have been recorded more often than losses (red). - Click to enlarge |
The Festive Season is More than Just ChristmasThe main reasons for the positive seasonal gold price performance between early August to late January are various festivities. After all, gold is not only an investment asset and an industrial metal. Around two thirds of annual gold production are used in jewelry. Not surprisingly, jewelry fabrication therefore affects prices. The festivities in turn are taking place at specific times of the year – and the associated gold purchases are following a similar pattern. There is not only Christmas near the end of the year, but major festive occasions in Asia are at least of equal importance, namely the Chinese New Year celebrations in February and the Indian wedding season in autumn. Gold is frequently given as a gift on occasion of these festivities. Naturally, jewelry merchants are stocking up on gold prior to the festive season and tend to push up the gold price in the process. What About Silver?
As our seasonal analysis (app.seasonax.com) has shown, silver’s industrial metal characteristics are far more pronounced. The next chart illustrates the seasonal trend of the silver price. As you can see, the seasonal price trend of silver in the course of the year is completely different from that of gold. Silver typically rises rapidly from the beginning of the year until the end of February. The annualized returns are considerable: they amount to 61.82% in the time-period from January 1 to February 23. |
Silver Price, 1 year(see more posts on silver prices, )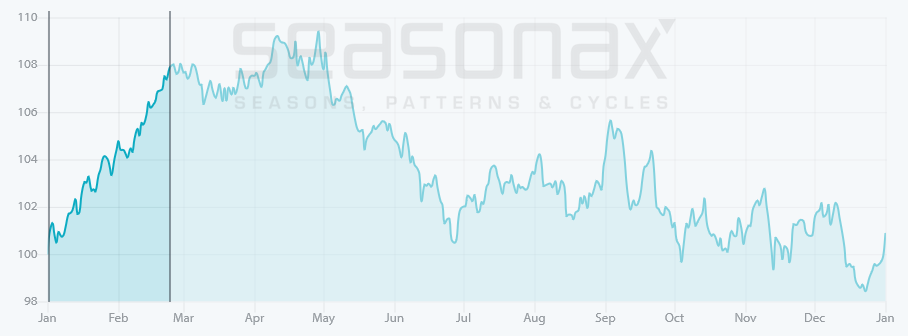 Silver exhibits a distinct and strong seasonal rally at the beginning of the year. - Click to enlarge |
A Different Picture Emerges in Industrial Metals
Interestingly, platinum and palladium prices are also exhibiting seasonal rallies at the beginning of the year – rather than from early August onward like gold. In other words, industrial demand is evidently the dominant driver of their seasonal price trends. The timing is probably due to the fact that many industrial users tend to place their buy orders early in the new financial year.
Such calendar-driven business practices appear not to be rational in the sense of obtaining the best possible prices. They are however understandable if one considers that in practice, annual planning and ordering procedures are often aligned with and determined by the financial year. Purchasers of precious metals are either unaware of seasonal price trends, or they are ignoring them because their in-house procedures are taking precedence. As an aside, seasonal business practices are by no means uncommon – they can be found in many industries, even in sectors in which one wouldn’t expect to find them.
Make Use of These Patterns
With the help of our Seasonax Web App, you can examine these patterns – using nothing more than your browser. You can analyze more than 12,000 assets and find seasonal patterns of your own. We invite you to visit our Website and test out the patterns we offer for free.
Keep in mind though that seasonal price trends are averages, deviations are therefore possible in some years. Nevertheless, seasonal trends can be of great benefit by making probabilities work in you favor!
Charts by: app.seasonax.com
Image caption & editing by PT
Full story here Are you the author?Tags: gold price,newsletter,Precious Metals,silver prices


