It is definitely one period that they got wrong. Still, IHS Markit’s Composite PMI for the US economy has been one of the better forward-looking indicators around. Tying to real GDP, this blend of manufacturing and services sentiment has predicted the general economic trend in the United States pretty closely. The latter half of 2015 was the big exception.
For November 2015, the composite index jumped to 56.1 from 55.0 in October. Coming as it did during those particular months of “global turmoil” and “manufacturing recession” this was taken as a sign the US really was the cleanest dirty shirt; at least in the services sector.
What Markit said at the time matched perfectly this general consensus:
The US economy is showing further robust economic growth in the fourth quarter, with the pace of expansion picking up in November.
The faster pace of growth and healthy hiring trend were accompanied by the sharpest rise in average selling prices seen for four months, providing a triple-boost to the chances of the Fed hiking interest rates at its next meeting.
The FOMC members would, in fact, vote for their first “rate hike” in nearly a decade the following month. Rather than kick off the long-awaited exit, however, it would be the only one for another year. Something went very wrong in between.
The PMI index around 56, according to Markit at the time, “brings the composite index up to a level indicative of 2.3% annualised GDP growth in November.” This “provid[ed] additional reassurance on the strength of the economy after yesterday’s upward GDP revision.”
GDP figures have been revised several times more over the years since, but they are largely in line today with how things actually went back then. There wasn’t any economic strength underlying anything anywhere, Markit’s composite PMI had been adrift in the clouds. Instead, real GDP is now thought to have been almost zero in Q4 2015, following in Q3 growth of less than 1%.
Those two plus the first quarter of 2016 completed what was nearly a recession cycle in the United States. The overseas turmoil hadn’t stayed overseas, something most people should remember of that period between August 2015 and February 2016.
| Last week, IHS Markit reported what they classified as another robust month of US expansion. The index, though, fell to 54.4 this month from 54.9 in October 2018. It was expected that, like three Novembers before, the PMI would rebound to 56.0.
Once again, we are told, the US economy is decoupled from renewed overseas turmoil. In the prior case, 2015, it hadn’t. And it really shouldn’t have been up for debate. There were clear signs the global economy was already in a downturn by early 2015. |
US Composite PMI and GDP, Jul 2012 - Nov 2018(see more posts on U.S. Gross Domestic Product, U.S. Markit Composite PMI, ) |
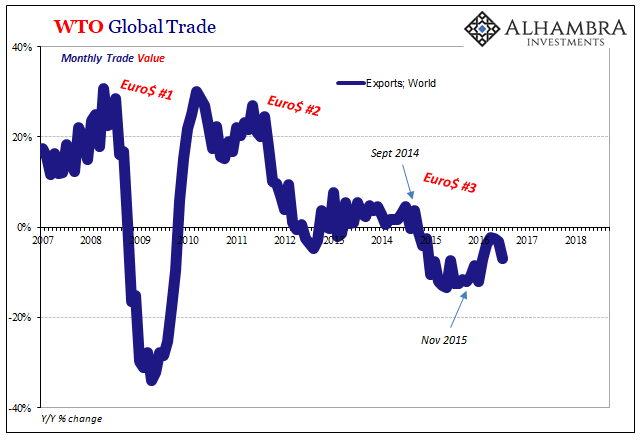
| Any number of trade figures clearly made that case. Here’s a set from the WTO:
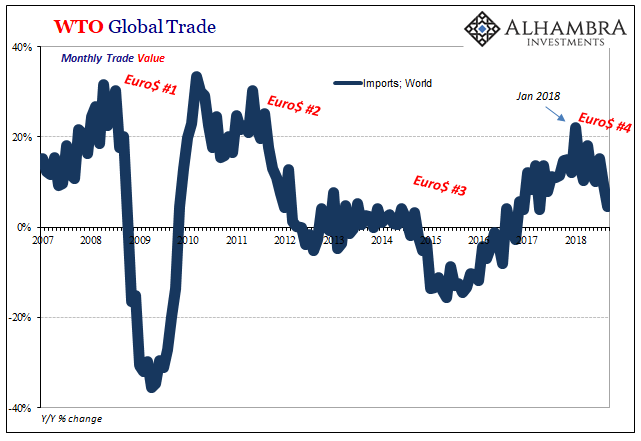
By the time Markit’s US composite was aiding the Federal Reserve’s narrative on hiking at the end of 2015, global trade had been in the red for more than a year already. This is where cause and effect really hurt not just the mainstream optimism but for the lack of solution. If you have no idea why global trade just suddenly collapsed, then a decoupling US economy seems an option. Overseas turmoil is someone else’s problem in this view. Knowing what was really behind the global downturn, however, you realized the US could not have been immune. The timing will never be exact, but in the end the eurodollar comes for everyone. Synchronized growth, decoupling fantasy, synchronized downturn. Rinse; repeat. |
WTO Global Trade, Exports World, 2007 - 2018 |
| This time around, a fourth “cycle”, Markit’s composite is performing slightly better. This doesn’t mean the index is higher; it isn’t. The track in 2018 is less in the clouds. They may still call the US economy “robust” (when don’t they?) but the direction rather than the level is what jumps out over the past four or five months. There is material slowing indicated at 54.
To that end, the WTO has some really bad news. Yesterday, the international body reported its outlook for global trade. It isn’t good.
This follows trade data already showing a clear slump for the global economy. Total export value across the world rose just 3.8% year-over-year in September 2018 (the latest monthly figures). That’s the slowest growth since early 2017, but more importantly the direction was already clear enough even before the WTOI’s forward looking below-trend 98.6. |
WTO Global Trade, World and Asia Exports, 2007 - 2018 |
| Trade wars are already being blamed and will continue to be blamed as things deteriorate further. There was no trade war three and four years ago. Overseas turmoil then was the product of dollar not tariff. Overseas turmoil now is the same thing, the only difference is the mainstream having been handed a convenient excuse. |
WTO Global Trade, World Imports, 2007 - 2018 |
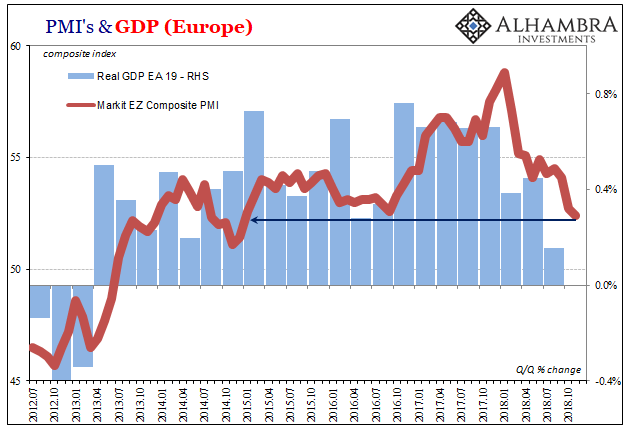
| Nowhere is this more evident than Europe. That continent is definitely overseas from the US perspective but is closer to home than people might realize. Markit’s November number for the Eurozone was downright awful, and even then it still trails the trend. |
Eurozone Markit Composite PMI and GDP, Jul 2012 - Nov 2018(see more posts on Eurozone Composite PMI, Eurozone Gross Domestic Product, ) |
| The composite PMI was 52.4 this month. It was the lowest reading in almost four years. Whatever “boom” that economy may have produced in 2017, and it truly wasn’t much, it is definitely all gone now. This is not derivative fallout from a largely US/China trade dispute, it is instead the direct consequences of European banks’ monetary involvement in Reflation #3 – and their immediate regrets upon starting up 2018. |
US Banking Data, Nov 2016 - 2018 |
| Overseas turmoil never turns out to be just overseas because it is global turmoil. The cycle has already started up again, another downward leg, the fourth, sitting right before us. Markets and financial data have been picking up this trend all year. It’s now hitting the economic tape, too. |
US Banking Data, Foreign Banks, Sep 1978 - 2018 |
Tags: Composite PMI,currencies,dollar,economy,EuroDollar,Europe,Eurozone Composite PMI,Eurozone Gross Domestic Product,exports,Federal Reserve/Monetary Policy,IHS Markit,imports,Markets,newsletter,PMI,U.S. Gross Domestic Product,U.S. Markit Composite PMI,World Trade,WTO


