


Jeffrey P. Snider
My articles My offerMy siteAbout meMy videosMy books
Follow on:LinkedINTwitterSeeking Alpha
| Trade war stuff didn’t really hit the tape until several months into 2018. There were some noises about it back in January, but there was also a prominent liquidation in global markets in the same month. If the world’s economy hit a wall in that particular month, which is the more likely candidate for blame?
We see it register in so many places. Canada, Europe, Brazil, etc. It does seem as if someone flipped a switch right at the beginning of this year. But that isn’t really true. Even in those places just mentioned you could see that there was already something off before 2018. This matched the global eurodollar system which unlike protectionism had broken into clear turmoil as far back as September 2017. In April of this year, Japan’s Ministry of Economy, Trade, and Industry reported what were then shocking figures (to some) for Industrial Production. In the month of January, when else, IP had collapsed by nearly 8% (seasonally-adjusted) from December 2017. Something big clearly hit Japan’s industrial base, which could only mean more than Japan. When we look at Japanese IP we find that it’s track record belongs to the eurodollar more than anything. I wrote in April:
|
Japan Industrial Production, NSA 2000-2018(see more posts on Japan Industrial Production, )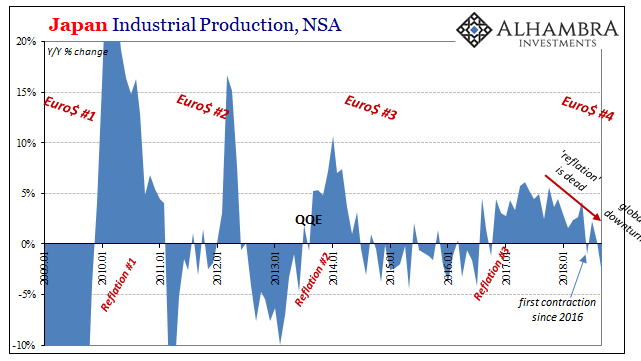 - Click to enlarge |
| IP grew at its fastest pace in the first half of 2017, peaking right when the Chinese economy did. That appeared to indicate economic trouble, at least, for globally synchronized growth since it was much too consistent with each low ceiling upswing we’ve experienced as a consequence of this dysfunctional global reserve currency system.
The big question relating to January was what it would mean for the rest of 2018. Was it a small bump in the road, truly transitory factors? Or was it the definitive announcement that reflation was dead and the next eurodollar squeeze was already squeezing the global economy? Definitive is too strong a term, of course, but over the months since then Japan’s IP as perhaps the best representation for the global economy in a single account has come close to that word. The latest data for September 2018 shows Japanese industry down a sharp 2.9% year-over-year (unadjusted). Like China’s manufacturing PMI, it’s the worst for Japan since July 2016. The ups and downs are pretty clear and obvious in this one data series. And since Japan is a gateway in the global supply chain, thus quite closely related to China’s economy, its bellwether status is easily defined. |
China NBS Manufacturing PMI 2005-2018(see more posts on China Manufacturing PMI, ) - Click to enlarge |
| Japan’s industrial production index gained 5.7% year-over-year (unadjusted) in October 2017. That was the last month where growth was somewhat decent, plausible to the idea of reflation. China’s official manufacturing PMI was calculated at 52.4 in the same month, the highest level for it within this cycle. The eurodollar warnings began in the first week of last September, so after October in each it’s been downhill since (not in straight line, of course). |
Chinese Money 2000-2018(see more posts on USD/CNY, ) - Click to enlarge |
| Japan’s industrial numbers match closely those from China. It’s not an Asian thing, nor is it trade wars – as Europe’s GDP estimate for Q3 showed yesterday. This is a fourth global economic downturn whose contours were somewhat visible at the start of 2018. Though it will be vigorously denied, it has only come into closer focus the more the year progresses. In the most recent data, there isn’t ambiguity; not even about what’s causing it. |
Dollar Correlations 2016-2018(see more posts on USD/CNY, ) - Click to enlarge |
Europe Real GDP 1995-2018 - Click to enlarge |
Tags: China,China Manufacturing PMI,currencies,dollar,economy,EuroDollar,eurodollar system,Federal Reserve/Monetary Policy,global trade,industrial production,Japan,Japan Industrial Production,manufacturing,Markets,newsletter,Reflation,USD-CNY


