


Keith Weiner
My articles My offerMy siteAbout meMy videosMy books
Follow on:LinkedINTwitterSeeking AlphaFacebookAmazonGoogle +
Let’s continue to look at the fiasco in the franc. We say “fiasco”, because anyone in Switzerland who is trying to save for retirement has been put on a treadmill, which is now running backwards at –¾ mph (yes, miles per hour in keeping with our treadmill analogy). Instead of being propelled forward towards their retirement goals by earning interest that compounds, they are losing principal. They will never reach their retirement goals. If you disagree, we encourage you to model it.
We say “fiasco” because living in retirement in Switzerland is like trying to live on a farm which does not grow crops. The farmer has to sell off pieces of the farm to buy groceries. As the Swiss retiree has to sell off pieces of his accumulated savings. Except the bank is also consuming his savings at -0.75%. It’s like a negative race.
Quantity Theory of MoneyThis disaster provides an interesting test of the quantity theory of money. Since mid-2013, the quantity of Swiss francs (as measured by M0) was around 380 billion. It went sideways until the end of December 2014. In January 2015, it was up to 450 billion. That move in itself, in 2-3 months, was 18%. But it first went off to the races, after that, hitting 561 billion by May 2017. In just over two years, it rose another 25%. Prices in Switzerland did not rise commensurately with these increases in the quantity of francs. But we are interested in matters monetary. We want to see how the franc fared against the dollar, from which it ultimately derives (the US M0 admittedly rose faster during this period—44%). Here’s a graph of the price of the franc against Swiss M0. This graph should be understood in the context of the attempt to fix the price of the franc, not against the dollar but the euro. The first part of the graph is really the trend of the euro, as the franc was fixed against that currency. But meanwhile, the market was furiously buying francs. In a vain attempt to defeat the market, the Swiss National Bank was ferociously issuing (borrowing) more. Especially in Dec 2014 and the first part of January 2015. The quantity of francs continues to increase after that through mid-2017, however there is little trend in the price. |
Price of Franc vs Swiss M0 - Click to enlarge |
The Drowning of YieldAnd in the breaking of this price-fixing scheme (all government price-fixing schemes inevitably break), something else happened. During the process of flooding the market with “whatever it takes” quantity of francs to keep the franc down against the euro, the interest rate was pushed negative. The yield on the 10-year bond went below zero in January 2015. Let’s look at a graph of price of the franc against yield. There is a much better correlation of price with yield. Why? The lower the yield, the less attractive it is to hold and the more attractive it is to borrow, to short it, to buy another currency whose yield hasn’t gone negative yet. Like the dollar. Capital flees a currency that deals them certain losses, to friendlier climates, where a return can be made. Currencies are arbitraged. Speculators may trade a currency based on news of change in its quantity. But the flows from arbitrage are larger and they’re durable. Think of it from the perspective of a bank. If you could borrow francs at -0.75% and invest in US Treasurys yielding 3.1%, would you do it? You would make nearly 4%! And this is on credit, based on a much smaller capital base. If you leverage up 10:1, you are making 40% return on capital. We suspect the depositors may not understand what risk they take to get their -75bps return. In any event, our main focus today is on one of the consequences of this deluge of francs. The flood drowned the yield curve. Yield is the measure of the productivity of capital. Any business that generates 10% return on capital is happy to pay a decent positive interest rate to get the capital it needs, say 5%. If the yield is negative, it means there is no return on capital to be found in the economy (at least in the larger firms who access the bond market). |
Price of Franc vs Yield 2014-2018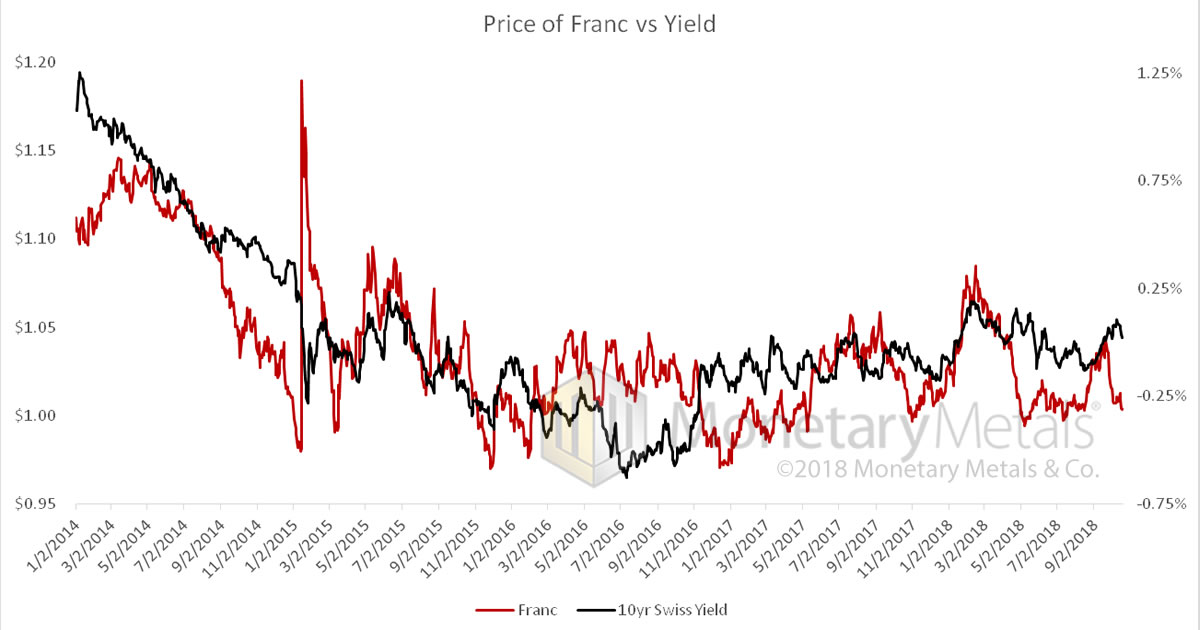 - Click to enlarge |
This is extraordinary. Such an excess of currency was high-pressure-pumped into the economy that every productive enterprise has drank its fill and the excess has spilled over.
When prices are administered by central planners—or in this case, suppressed under the weight of hundreds of billions of uneconomic francs—market participants cannot tell real supply from the illusion of supply imposed by the government.
This sea of francs is not real capital. A central bank cannot create more capital. It can merely cause capital mispricing, and hence market participants to misallocate it, based on their misperceptions. This is well understood material (by Austrians).
The Franc is Now Useless
Therefore we want to look at a different angle. As we said last week:
“…the problem is that the Swiss National Bank so flooded the market with francs that they’re now useless.”
So useless that the bid for using them is negative! Think about that. Take as long as you need.
The bid to use a franc is negative. We say extraordinary, because the English language lacks a word that fully describes this incredible state of the market.
We recall, shortly after the global financial crisis, reading about a piece of real estate in Houston, TX. The land would be worth (if we recall) $10,000. But, with an uneconomic building on it, the real estate was actually worth -$15,000. That building had a negative use value, and therefore the property had a negative market value due to the cost to demolish it being above the value of the raw land.
The franc now (for almost four years) has a negative use value and hence the use has a negative market value. You have to pay someone to borrow it from you. Because he has nothing good to do with it.
The Swiss National Bank increased the quantity of francs. But it did not succeed in making the currency worthless. It did not really trend downward against the dollar. Or gold—it was trending up measured in gold in 2013, and sideways from Q4 2013 through today.
Instead, it made it useless.
This leaves us with one question to answer. Why does a thing which has negative use-value have high market value? That real estate we mentioned above had negative market value. Why doesn’t the franc also have negative market value?
First, everyone in the world believes the franc to be a high-quality currency. It is not going to collapse so long as there is worldwide buying pressure,
More importantly, is the reason why every government-issued currency has value. Every debtor is working harder and harder, the lower the interest rate falls, to produce goods. Lower interest rates cause them to work harder, because more competitors invest more capital to add more production capacity. The artificially falling rate causes artificially frenetic activity.
The debtor-producers dump their goods on the bid price. This is the opposite of hyperinflation. Everyone sees that the currency has strong, if not rising, purchasing power. So they feel no need to dump their currency (other than the pain of losing 75bps).
This is a dangerous situation. We liken it to an unstable equilibrium, like a cone balanced on its point. A gust of wind will tip over the cone. What will tip over a currency that has become useless? What could cause a useless currency to become worthless?
We will discuss that next week.
This Report was written from New York City. Also visit London, Brussels, Madrid, Zurich, Hong Kong, Singapore, Sydney, and Auckland. If you would like to meet, please contact us.
Supply and Demand Fundamentals
The price of yellow metal went up nine bucks. And the price of silver three rose cents, which is back to where it was two weeks ago.
We need to rant, and promise to tie it back to the prices of the metals. We have written these past several weeks about the fact that the franc has been rendered useless. Owning a franc does nothing for you, other than to trade to the next person at hopefully a higher price. This is the state into which gold has been forced, by a series of actions by the US and other governments.
Indeed, so useless has gold become, that we measure its value in terms of the irredeemable fiat dollar. We all love to hate the dollar, we all think the dollar will collapse at some point in the future. Yet so ubiquitous—and useful—is it that we measure even money in terms of dollars!
And “we” does not refer to Keynesians and their close cousins the Monetarists. “We” refers to many Monetary Metals clients and prospective clients. Yes, truly, the folks that are keen to earn interest on their money paid in money—gold—ask constantly our opinion on the price of money in terms of irredeemable Fed credit notes!
No magic words do we possess to help them get their heads around this radical new heliocentric / gold-centric paradigm. We can quote JP Morgan’s testimony before Congress, “money is gold, nothing else” until we are blue in the face. We can draw a conceptual picture of the lighthouse going up from the ship of a sinking deck, or measuring a steel meter stick as 3.2 rubber bands in length. We can make a distinction between investing in gold vs gold investing—betting on the price vs investing gold to make a gold return. We can bellow from the rooftops that the Fed publishes on its website that it has an Orwellian definition of “price stability”—two percent debasement per annum.
| Still people persist in measuring gold in terms of dollars. Still they wish for that steel meter stick to grow longer, which means for the rubber bands to contract.
What’s the point of this rant? Here is the point. By 1923, no German thought of the paper mark as money by which to measure the value of anything. By 2009, no Zimbabwean thought of the Zimbabwe dollar as money. By now (we assume) few Venezuelans measure economic value in bolivars. Our purpose in ranting here, and of much of our writing, is to help people make this realization before the dollar goes the way of the papiermark and bolivar. With knowledge comes power. And better decision-making. This concludes our rant. Now we will look at the only true picture of the supply and demand fundamentals of gold and silver. But, first, here is the chart of the prices of gold and silver. |
Gold and Silver Price(see more posts on gold price, silver price, )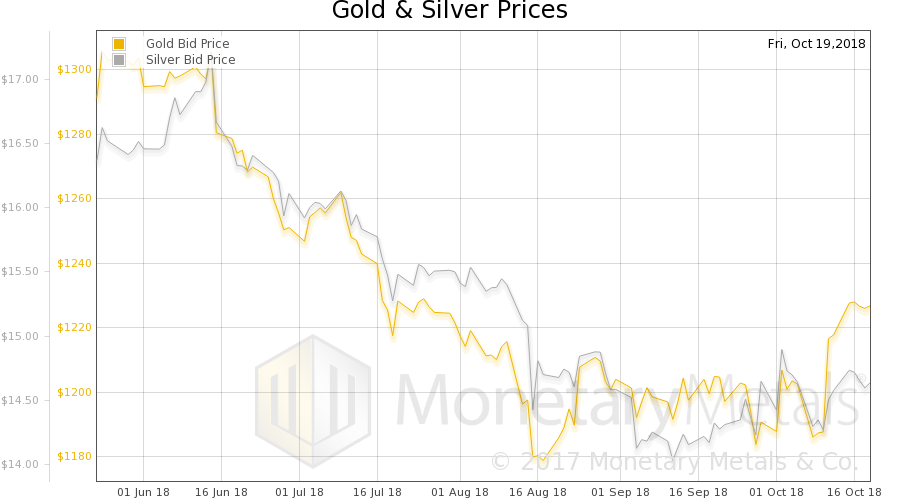 - Click to enlarge |
Gold:Silver RatioNext, this is a graph of the gold price measured in silver, otherwise known as the gold to silver ratio (see here for an explanation of bid and offer prices for the ratio). It rose slightly this week. |
Gold:Silver Ratio(see more posts on gold silver ratio, )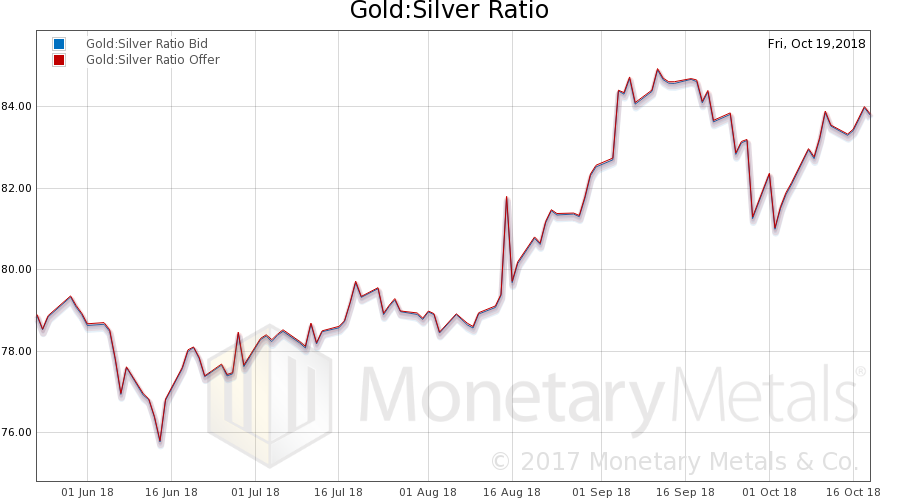 - Click to enlarge |
Gold Basis and Gold Co-basisHere is the gold graph showing gold basis, cobasis and the price of the dollar in terms of gold price. The price of gold rose (depicted here as it truly is, a drop in the price of the dollar) and its scarcity (i.e. cobasis) rose with it. That means there was some buying of physical metal. The Monetary Metals Gold Fundamental Price rose further, from $1,299 to $1,306. |
Gold Basis and Gold Co-basis(see more posts on dollar price, gold basis, Gold co-basis, ) - Click to enlarge |
Silver Basis and Silver Co-basisNow let’s look at silver. Silver also became scarcer, though its price didn’t rise much. |
Silver Basis and Silver Co-basis(see more posts on dollar price, silver basis, Silver co-basis, )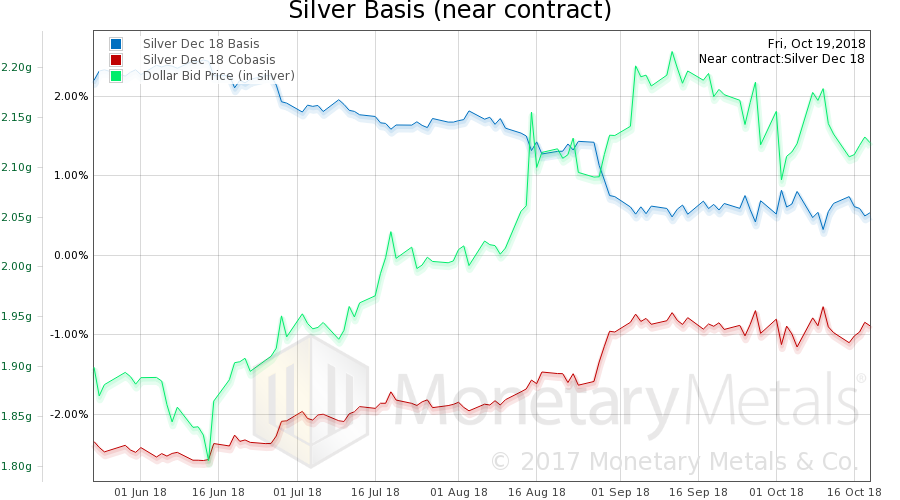 - Click to enlarge |
The Monetary Metals Silver Fundamental Price rose from $15.31 to $15.40.
© 2018 Monetary Metals
Full story here Are you the author?Tags: Basic Reports,dollar price,gold basis,Gold co-basis,gold investing,gold price,gold silver ratio,negative interest,newsletter,silver basis,Silver co-basis,silver price,yield


