


This has already been one of the longest economic expansions on record for the US and there is little in the data or markets to indicate that is about to come to an end. Current levels of the yield curve are comparable to late 2005 in the last cycle. It was almost two years later before we even had an inkling of a problem and even in the summer of 2008 – nearly three years later – there was still a robust debate about whether the US could avoid recession. The answer was, of course, no but we didn’t know that for sure until Lehman failed in September of 2008.
Our views on the economy are driven more by market based indicators than the economic data itself. We use these monthly reviews to look at all the data and try to sketch a picture, a snapshot of the economy. But our investment process doesn’t depend on our ability to interpret the data as it comes in. We rely more on the wisdom of crowds, the wisdom of the market to make portfolio decisions. And while we review a lot of different markets in these updates, we rely almost exclusively on two indicators to pinpoint the onset of recession – the yield curve and credit spreads.
There has been a lot of debate recently about the efficacy of the yield curve as a recession indicator. Several Fed Governors have expressed the opinion that the curve is not of concern to them and doesn’t have the same predictive power it has in the past. Of course, we hear this every cycle and so far the yield curve is pitching a shutout so I’ll continue to pay attention to the curve and ignore the ramblings of economists who think they are smarter than the market.
I also have no doubts about credit spreads; they will widen prior to the next recession. Indeed, it may be the widening that causes recession but that is more speculative and not helpful in the business of identifying the onset of recession. Neither of these indicators is perfect and both tend to start warning of a problem long before it actually occurs. But this is one instance where I’d much prefer to be early than even a little late.
In the last cycle, the yield curve first inverted in February of 2006 although it turned positive again that spring. It inverted again in the summer and stayed that way until March of 2007. After trading around the zero line for a while it finally started to steepen in earnest in June of 2007. The inversion of the curve was an initial warning sign but the more timely signal was this steepening because of the way it happened. In this case the curve steepened because the 2 year Treasury note yield started to drop rapidly, outpacing the drop in the 10 year yield. By the summer and fall of 2007 the short end of the curve was collapsing.
At the same time the 10 year Treasury note yield was falling too but not as rapidly. This divergence in the rate of change is the difference between short and long term nominal growth expectations. Expectations for long term growth are hard to change – they are anchored in economist-speak – while short term rates are driven mostly by expectations of Fed policy.
The 10 year TIPS yield was also falling by the summer and fall of 2007. We look at TIPS and nominal Treasuries to get a feel for the breakdown between changing expectations for inflation and real growth. The nominal 10 year Treasury yield has in the past generally traded around the level of nominal GDP growth. So, if we look at real yields and nominal yields, we can infer how expectations for real growth and inflation are changing. And in the fall of 2007 both real growth and inflation expectations were falling.
Credit spreads also started to widen rather abruptly in June and July of 2007 and had more than doubled by the onset of recession. Risk aversion was obvious and accelerating by the end of 2007.
In these market based indicators we had full agreement by the fall of 2007 that the economy was headed for significant trouble. The yield curve had inverted and started to steepen rapidly by the fall of 2007. Short term rates were falling rapidly, long term rates were also falling but at a slower rate. Real yields (TIPS) were also falling and credit spreads were widening. By the end of 2007 there was little doubt that a recession was on the way. Could it have been averted? Maybe, maybe not. Once risk aversion starts it is hard to stop.
Notice too that it isn’t the yield curve inversion that is important from a signaling standpoint. It is the rapid steepening of the curve as short term rates fall more rapidly than long term rates that signals the onset of trouble. Everyone focused on an inversion today, including those ridiculous Fed Governors, are watching the wrong thing.
Economic data just doesn’t give you much in the way of warning when it comes to recession. Consumer sentiment did fall during the entire year of 2007 but the peak in that metric was actually in 2004. And the level at the beginning of the recession was still about the same as October of 2005. Housing starts were falling rapidly by 2006 but that is more a unique aspect of that cycle rather than all of them. In the 90s, housing starts rose right through recession while in the 80s, they peaked in ’86 and fell all the way to recession in 1990. Employment? The economy added over 100,000 jobs in November and December of 2007.
Trade? No big effect on our trade balance until November of 2008. Durable goods orders peaked in December of 2007 but didn’t really fall much until the summer of 2008. Core capital goods orders didn’t peak until April 2008. Total business inventory/sales ratio hit its low for the cycle in June 2008. Retail sales were showing positive year over year change until September 2008. Industrial production didn’t turn negative year over year until April 2008. Even the Chicago Fed National Activity index, which we cite frequently didn’t give a recession signal until February 2008.
I don’t know when the next recession will start and neither does anyone else. But I am confident that watching the right things can give us advance warning. The economic data will, more than likely, be a mere confirmation of what our market based indicators have already warned us about. The four most dangerous words for an investor are “it’s different this time” but every business cycle is different. What isn’t different is how the markets – yield curve, credit spreads, bond markets, etc. – anticipate the end of the cycle. And the end is not nigh.
Economic Reports
Economic Growth & InvestmentThe Chicago Fed National Activity Index is still being affected to some degree by the fire at an auto supplier a couple of months back but the three month average is just 0.05, which is consistent with the year over year growth of GDP at 2.9%. US economic growth is just slightly above average for this cycle and that is reflected by a wide range of indicators – which is what the CFNAI represents. The most concerning readings we’ve had on the economy over the last few months have been related to real estate. In this category, existing home sales were, once again, less than expected last month. The lack of resales has been blamed on a lack of inventory but that explanation is starting to look stale. Supply is up to 4.3 months at the current sales rate which is a little lower than the long term average but not by much. A more important factor I think is price and on that front the latest report offered some respite as the median price fell. Another factor is the mortgage process which is now much more comprehensive than in the past and also requires a more substantial downpayment. Whatever the cause, real estate appears to be slowing in all categories. Personal income continues to rise but the gains are subdued. Previous cycles have seen much higher growth rates of income. The savings rate is holding steady at a fairly high rate – at least based on recent cycles – and that is a long term positive. You can’t have investment without savings. Corporate profits were reported with the GDP revision, gaining 16.1% in Q2. That isn’t quite as good as what we’ve seen from the large companies in the S&P 500 but it is very good. What it isn’t, is sustainable. We will not get another reduction in the corporate tax rate next year so underlying revenue growth is probably more indicative of actual growth. On that score, total business sales growth is just half of profit growth but 8% still isn’t bad for a large, developed economy late in a business cycle. Productivity rebounded in the second quarter but if there was ever a time when the phrase “one report doesn’t make a trend” was appropriate, this is it. Productivity growth has been in a downtrend since the turn of the century and this report doesn’t change that. And until it does, expectations for a higher economic growth rate will continue to be frustrated. |
Economic Growth & Investment, September 20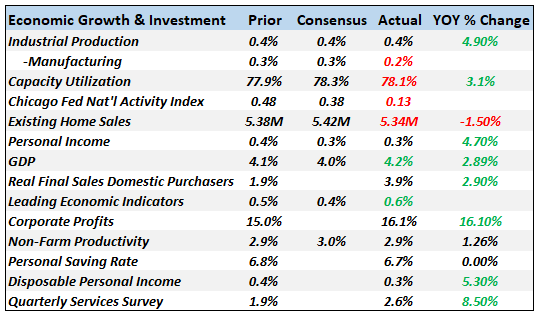 . |
ProductionThere are some preliminary signs of some moderation in these sentiment surveys but the outlook remains positive. As I’ve said many times though, these indicators are not that useful for identifying tops so I don’t put a lot of weight on them. |
Production, September 20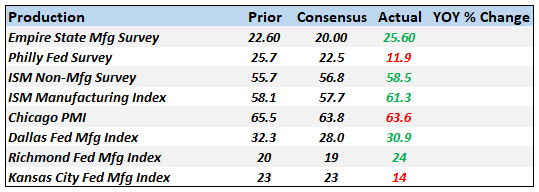 - Click to enlarge |
Consumption & DistributionRetail sales came in a bit soft but that was after big gains in July. Of course, we don’t know, but do suspect, that July’s surge was somewhat tariff related and may have brought some sales forward. August was held back by a drop in vehicle sales which are doing what they do at this point in the cycle, namely going sideways after peaking. Wholesale sales were also weak and inventories are still building so some slowing in coming months might be expected. Consumption at these growth rates looks good in isolation but as Jeff and I have pointed out numerous times, consumption peaks in previous cycles were in the high single digit, low double digit range. Growing at 5% or 6% just isn’t that great. Higher consumption requires either a lower savings rate or faster income growth. We don’t want the former and can’t seem to generate the latter. |
Consumption & Distribution, September 20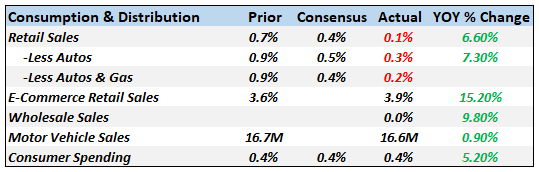 - Click to enlarge |
InventoriesRecently inventories have been building faster than sales and the inventory/sales ratios have stopped falling. Longer term, year over year, sales are still growing faster than inventories but the recent trend is a bit worrisome. |
Inventories, September 20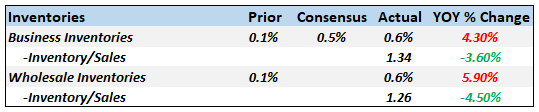 - Click to enlarge |
OrdersDurable goods and factory orders have been weak recently but the important core capital goods reading has logged three straight pretty good months. This indirect measure of investment – which is critical to raising productivity growth – is right near the all time high. If the recent trend continues that is very good news but I think I’ll keep the champagne on ice for now. This latest reading is only marginally higher than April of 2008 and June of 2000 and just below the peak in March of 2012. In other words, we’ve been here before and been disappointed. But if you want to know why productivity growth has been slow since 2000, you don’t need to look any further than this number. |
Orders, September 20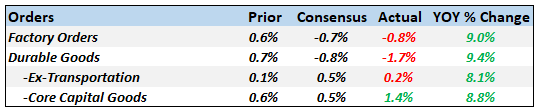 - Click to enlarge |
TradeI suppose it is possible that President Trump’s trade policies will eventually reduce the trade deficit but there is no evidence of it yet. I’m sure exports down/imports up isn’t what the administration expected from their tariffs but that is what they’re getting. As for whether the policies will eventually “succeed” in reducing the trade deficit, I would just point out that the only time in recent decades the deficit has fallen is during recession. If the administration keeps adding taxes to the economy – and make no mistake, tariffs are taxes on consumption – they’ll eventually get their wish. |
Trade, September 20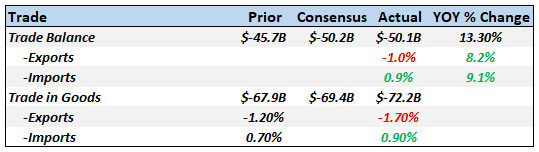 - Click to enlarge |
InflationBoth CPI and PPI moderated in the most recent readings. Import and export prices were both down in the latest reports. The year over year readings are still a little hot but with the dollar strong to stable I don’t think inflation is much of a concern right now. Based on Powell’s speech at Jackson Hole, I don’t think he does either. |
Inflation, September 20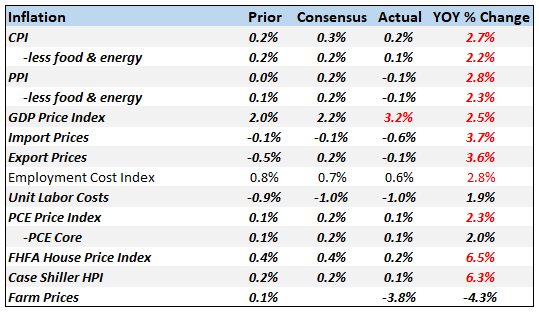 - Click to enlarge |
EmploymentThe labor market is not as good as the JOLTS report indicates and probably not as bad as the most recent household survey which showed an outright drop in the number of employed. Like so much with the economy, employment hasn’t changed a lot despite the chest thumping of the Trump administration. Monthly averages are down a little from the Obama trend but not significantly. But the workweek isn’t extending and real wages aren’t rising. That does not scream tight labor market to me. Jobless claims are still hitting multi-decade lows which sounds great but that may be partially because the nature of the jobs market has changed. Gig economy workers can’t file for unemployment benefits. How much of an impact is the changing nature of work having on jobless claims? I don’t know but it isn’t zero. We’ll probably know more after the next recession. In the meantime I would not put a lot of emphasis on these reports. One thing to keep an eye on is the Challenger Job Cuts which are up four months in a row and 7.5% over the same period last year. This report is also probably not as relevant as in the past but it should still be relevant from a directional standpoint. |
Employment, September 20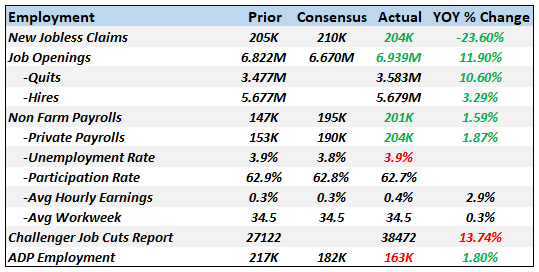 - Click to enlarge |
ConstructionLike the existing home report, new home construction and sales are starting to stall. Sales in the most recent month were about the same as July 2016. Starts are at about the same level as June 2015. Overall, construction spending is still rising but the rate of change has definitely slowed. |
Construction, September 20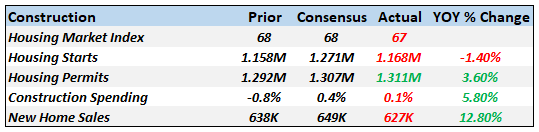 . |
SentimentAll measures of confidence show lots of it. These are coincident indicators, economic weather vanes if you will. |
Sentiment, September 20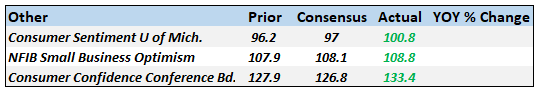 - Click to enlarge |
Market Indicators10-Year Treasury Note YieldThe 10 year Treasury note yield is right back to the top of its range and on the verge of breaking out. The bond market appears to be adjusting its view of growth up slightly. |
10-Year Treasury Note Yield, September 2018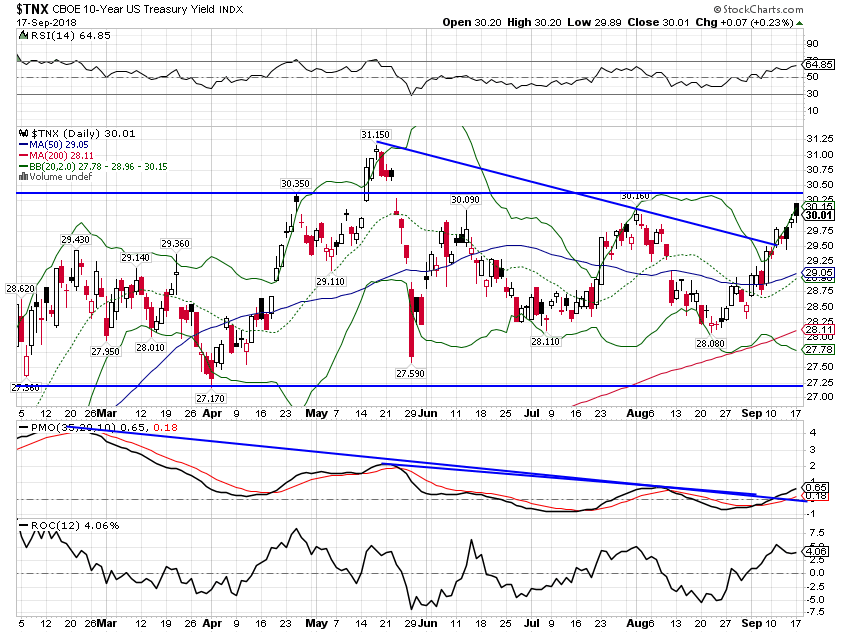 - Click to enlarge |
10-Year TIPS YieldThe change in nominal rates is being nearly matched by the change in real rates. The 10 year TIPS yield moved higher on the month by about 10 basis points. |
10-Year Treasury Inflation-Index Security 2004-2018 . |
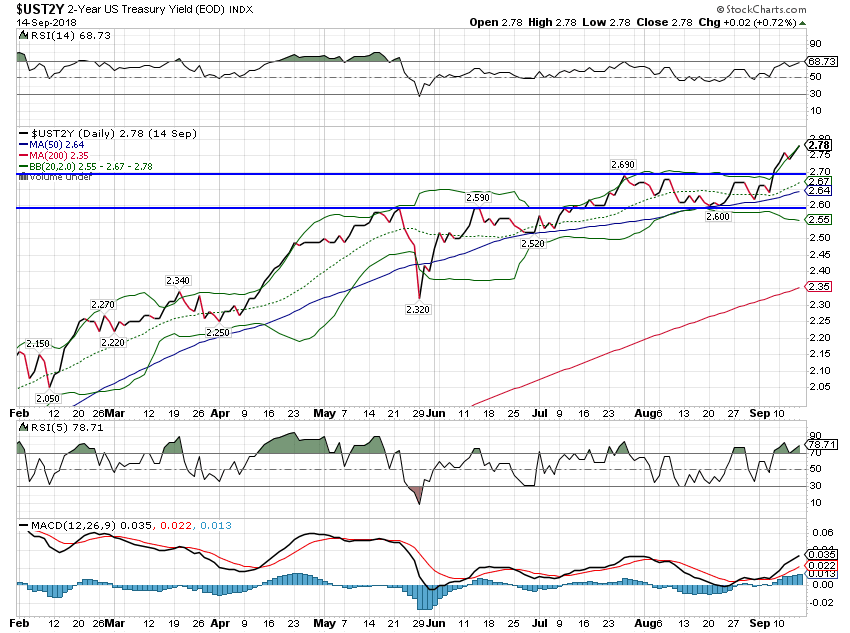
2-Year Treasury YieldThe 2 year Treasury note yield finally broke out of the range of the last few months as the Fed meeting draws closer. A hike at the September meeting is probably in the bag but I’m not as sure about December. I may be reading too much into Chairman Powell’s Jackson Hole speech but I think he made a pretty good case for a pause soon. |
 . |
10/2 Yield CurveThe yield curve continues its flattening trend but there is nothing going on here that is unusual or points to a problem. For comparison purposes, we hit this level in the last cycle in the fall of 2005. |
Yield Curve - 2 Year Bonds Index September 2018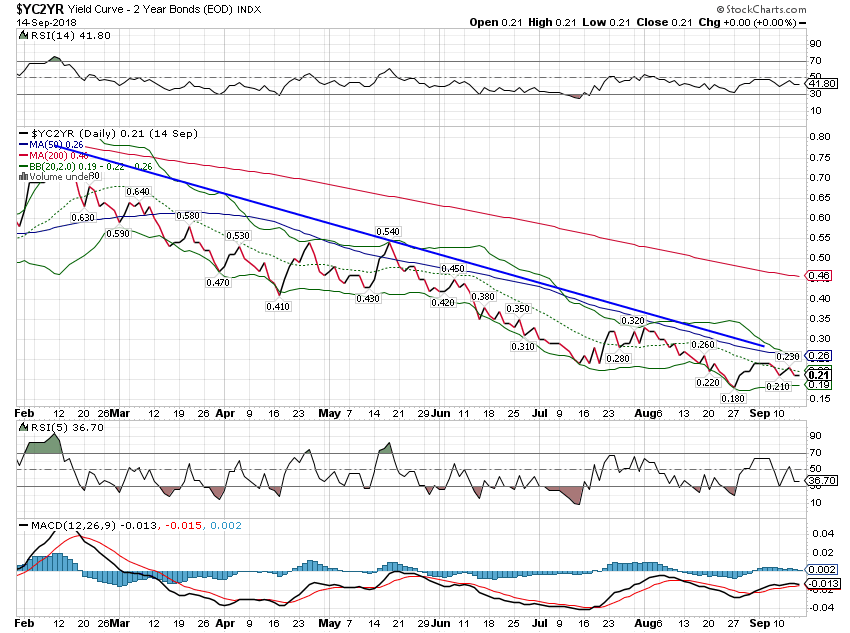 - Click to enlarge |
Credit SpreadsCredit spreads are narrowing once again. We are within a whisker of the low for this cycle and as I’ve said many times before, it can go lower yet. There is absolutely no stress at all in the junk bond market. That will change when the next recession hits but that doesn’t seem imminent. |
ICE BofAML US high Yield Master II Option-Adjusted Spread, 1998-2018 - Click to enlarge |
US DollarThe dollar breakout we noted last month didn’t last long and for now the dollar rally is on hold. With US growth expectations rising the course of the dollar is really more about what happens with growth expectations outside the US. And what that really means is that the course of the dollar is to a large degree a function of trade negotiations. On that front, not much positive progress has been made with Canada or Europe. But there hasn’t been much negative news either and status quo is better than the alternative. International growth expectations seem to have stabilized, in Europe where the Euro has been quite resilient of late and Japan where growth recently surprised to the upside. We haven’t seen any progress on China and I still don’t expect any anytime soon. China is the all-purpose, bipartisan boogie man, the country all US politicians can bash and blame for any economic ill that befalls America. The market did take the recent imposition of 10% tariffs on $200 billion in Chinese goods in stride but that was more a sell the rumor buy the news event. The market seems to be betting that a resolution can be found in the next few months before the tariff rate rises to the scheduled 25% in 2019. We’ll see but I generally put that into the wishful thinking category. The trade negotiations with China really have a more direct impact on EM currencies, not the more popular dollar index. And even EM currencies have bounced in recent days although the downtrend so far looks intact. I do think we are starting to seem some differentiation between the various EM countries and their currencies. Every country labeled emerging is not Turkey or Argentina and surely not China. |
US Dollar Index - Cash Settle 2016-2018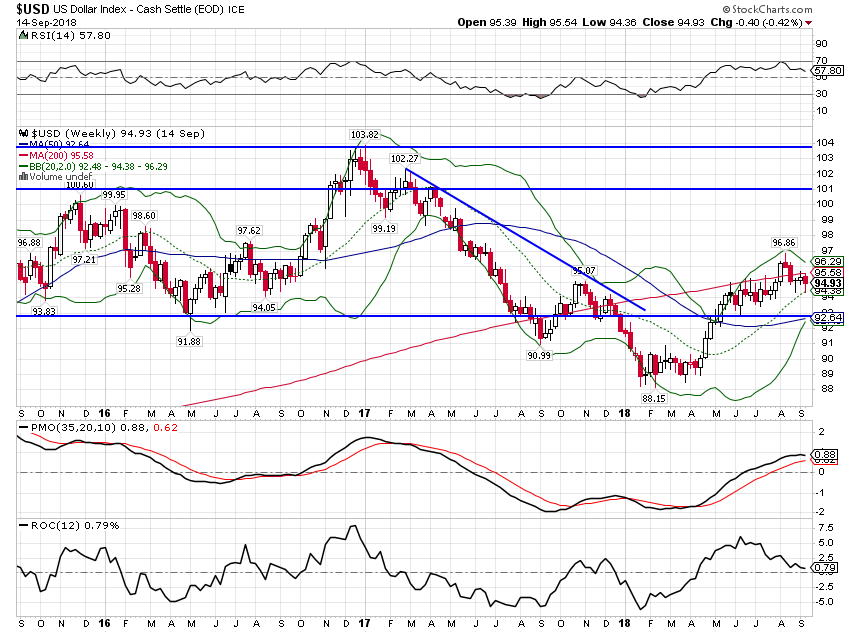 - Click to enlarge |
EM Currency ETF |
WisdomTree Emerging Currency Strategy Fund, September 2018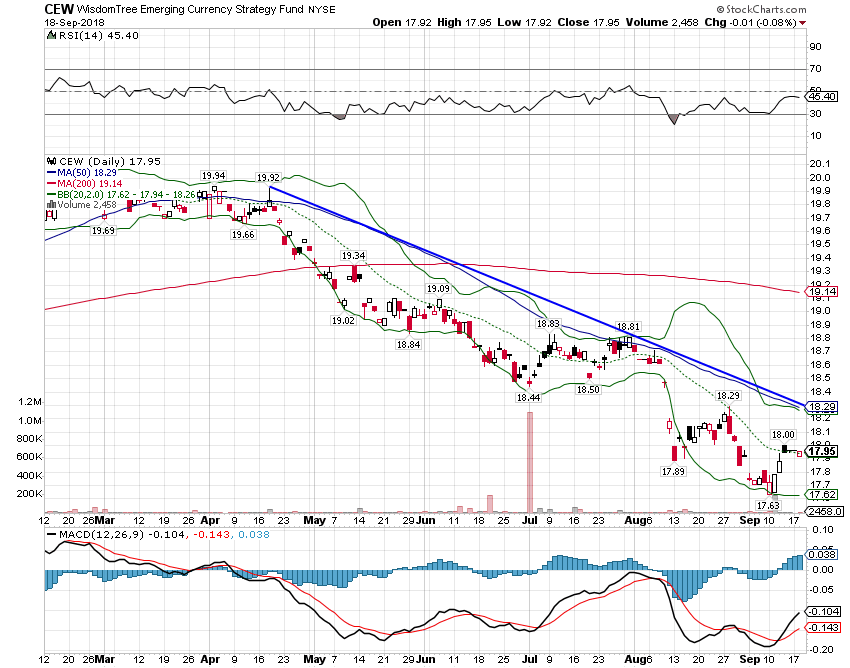 - Click to enlarge |
CommoditiesGold has stabilized over the last month and the short term downtrend appears to be coming to an end. That is, of course, mostly a function of the dollar. The dollar stopped going up and gold stopped going down. But the short term trend here is still down, reflecting solid growth expectations. |
Gold - Continuous Contract September 2018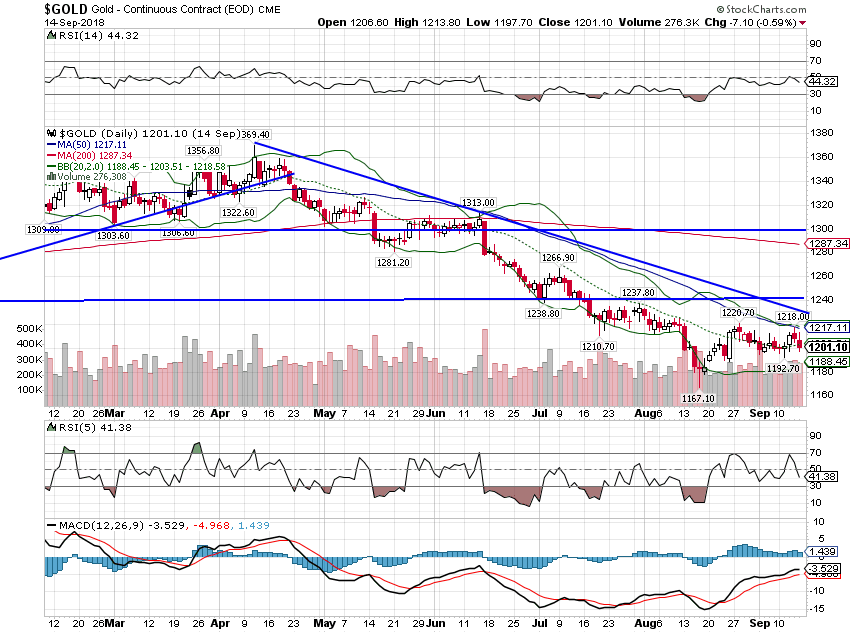 - Click to enlarge |
| The GSCI commodity index is higher since the last update but the trend here is a lack of one. This particular commodity index has benefited from a heavy weighting in energy which has bucked the weaker trend of most commodities. |
S&P GSCI Commodity Index, September 2018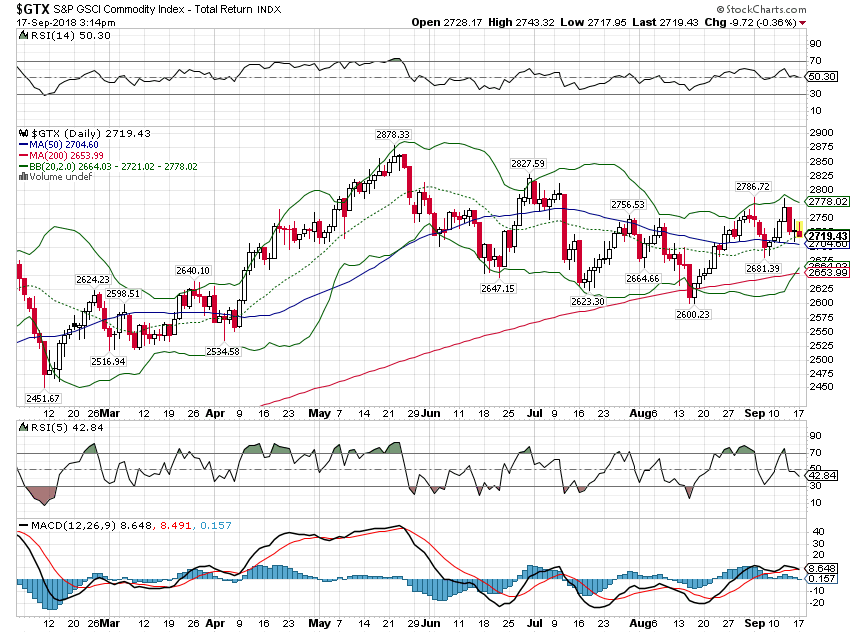 - Click to enlarge |
| The broader Bloomberg Commodity index was down a bit since the last update. Commodities generally bottomed in early 2016 but so far haven’t gained much upside momentum. Generally commodities and stocks go through long opposing cycles. Strong dollar periods tend to be negative for commodities and very positive for stocks – where we’ve been for most of the last decade – while strong commodity periods are marked by a weak dollar (2002 – 2008). I suspect this is one of those long term inflection points but until the dollar gets in a trend one way or the other it is hard to say. The dollar has basically been trendless – with some volatility – since 2015. |
Bloomberg Commodity Index, September 2018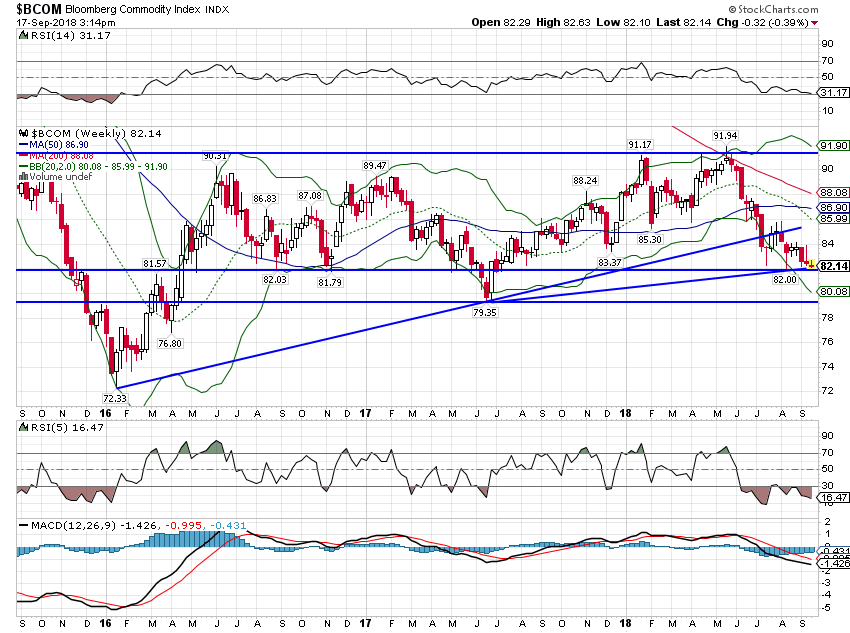 - Click to enlarge |
| The copper to gold ratio is perking up a little but probably not enough to confirm the rising 10 year note yield.
So, to review our major indicators, the yield curve is flattening but not inverted. 2 year note yields are rising as are nominal and real 10 year rates. Credit spreads are still narrowing. There are, as always, things to worry about. Trade tops the list today but as much as I disagree with the administration’s approach to negotiating, I can’t say there has been a large impact – yet. And if there is eventually, I am certain our market indicators will let us know. |
Cooper-Continuous Contact/Gold-Continuous Contact, September 2018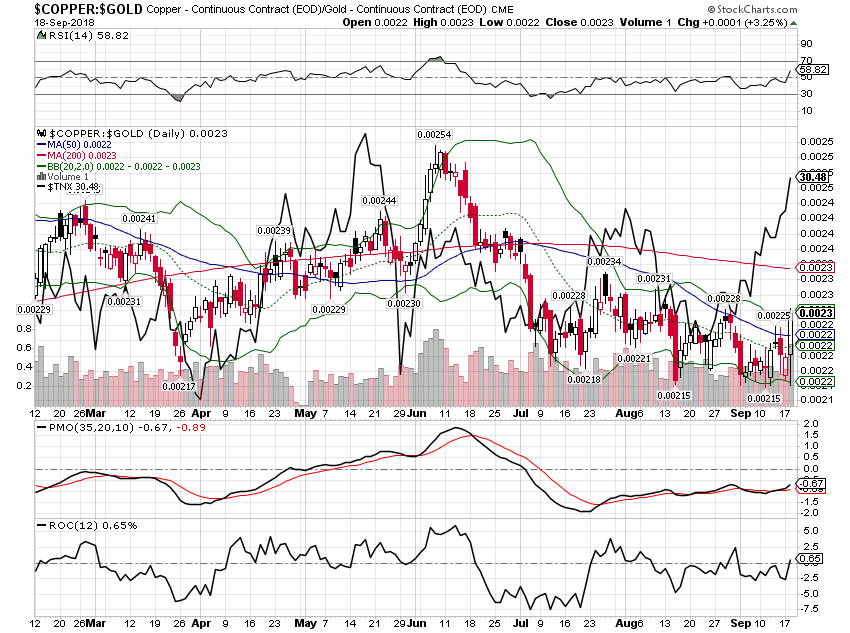 - Click to enlarge |
Tags: Alhambra Research,Bonds,commodities,copper/gold ratio,credit spreads,currencies,Gold,inflation,Interest rates,Markets,Monthly Macro Monitor,newsletter,recession,TIPS,treasuries,US dollar,Yield Curve


