


Keith Weiner
My articles My offerMy siteAbout meMy videosMy books
Follow on:LinkedINTwitterSeeking AlphaFacebookAmazonGoogle +
Fundamental Developments – The Gap Keeps WideningLast week, the lighthouse went down 24 meters (gold went down $24), or 50 inches (if you prefer, silver went down 50 cents). However, let’s take a look at the only true picture of supply and demand. Are the fundamentals dropping with the market price? |
 They done whacked our lighthouse! [PT] Image credit: Skip Willits - Click to enlarge |
Gold and Silver PriceWe will look at an updated picture of the supply and demand picture. But first, here is the chart of the prices of gold and silver. |
Gold and Silver Price(see more posts on gold price, silver price, )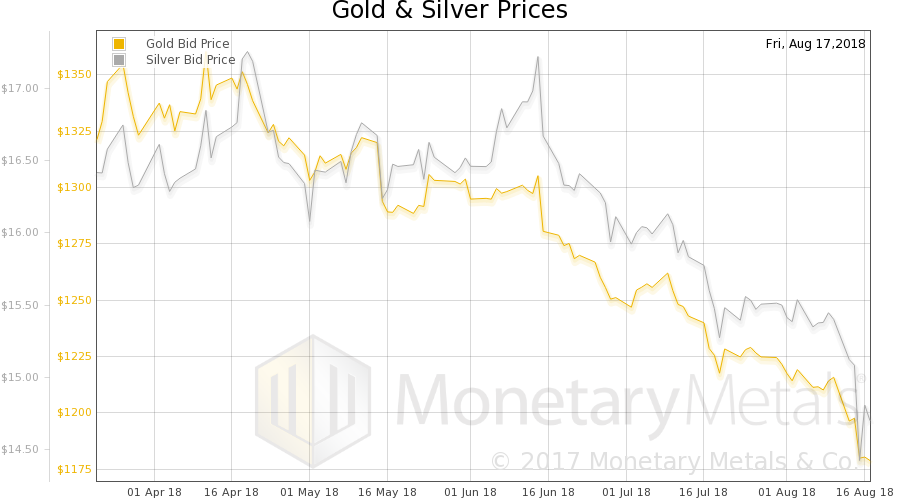 Lighthouses priced in USD - Click to enlarge |
Gold Silver RatioNext, this is a graph of the gold price measured in silver, otherwise known as the gold to silver ratio (see here for an explanation of bid and offer prices for the ratio). It rose last week. |
Gold:Silver Ratio(see more posts on gold silver ratio, )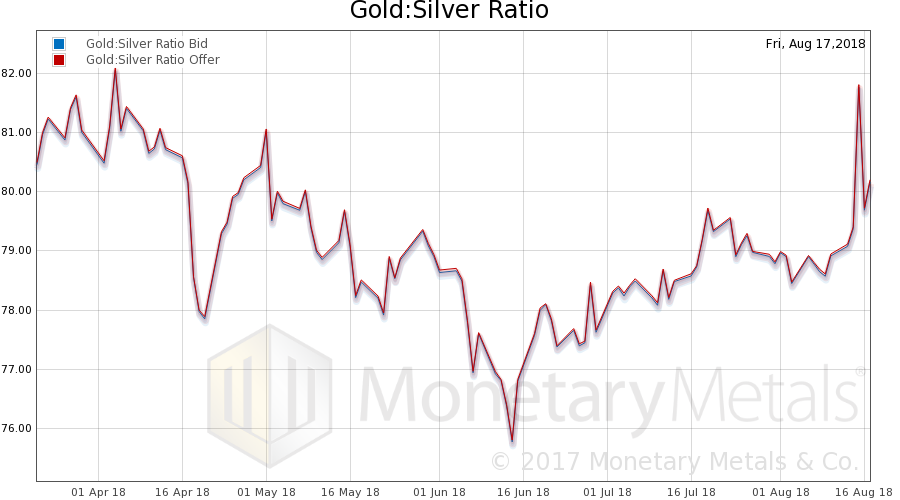 Gold-silver ratio - Click to enlarge |
Gold Basis and Co-basisHere is the gold graph showing gold basis, co-basis and the price of the dollar in terms of gold price. We see the big move up in the dollar (ok, ok, down in gold if you insist on thinking in such terms!). And with it, a rise in the co-basis (i.e., the scarcity of gold). |
Gold Basis and Co-basis and the Dollar Price(see more posts on dollar price, gold basis, Gold co-basis, )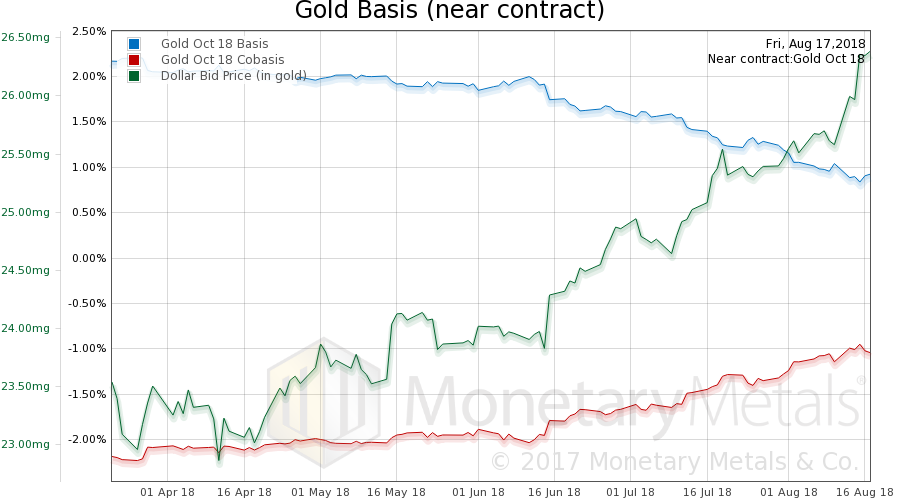 Gold basis, co-basis and the USD priced in milligrams of gold - Click to enlarge |
Gold Fundamental PriceUnlike the market price, the Monetary Metals Gold Fundamental Price did not move that much. While the market price fell $24, the fundamental price fell $8, from $1,303 to $1,295. Here an updated chart of the fundamental gold price vs. the market price: |
Gold Fundamental Price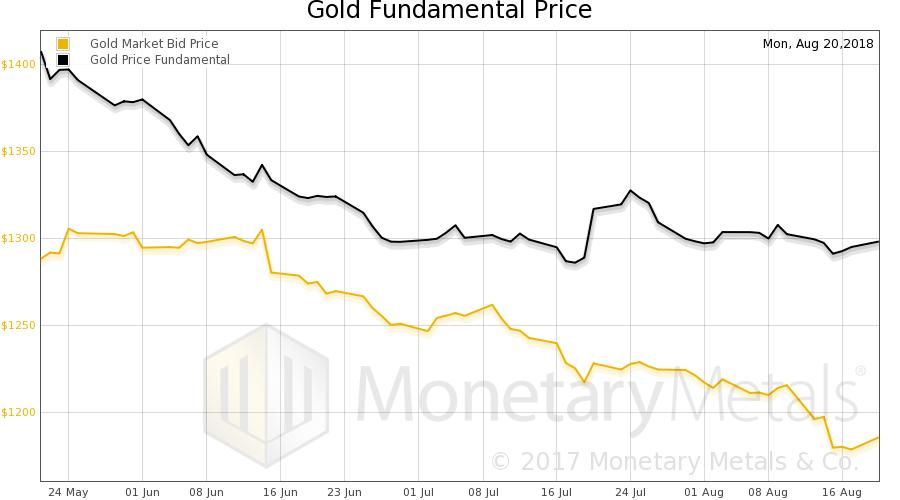 Theoretical fundamental gold price vs. market price: a growing gap [PT] - Click to enlarge |
Silver Basis and Co-basisNow let’s look at silver. With this drop in price (and as the Sep contract rapidly approaches expiry, and hence is under selling pressure, causing a falling basis and rising co-basis) we see the September silver co-basis has risen above zero — backwardation. Farther out months are not so dramatic, but the same move occurs. The Monetary Metals Silver Fundamental Price fell only 4 by cents, from $16.23 to $16.19. Pretty remarkable for a week in which the market price dropped so much. The fundamentals of gold look pretty firm and those of silver may be firming up here as well. |
Silver basis, co-basis and the USD priced in grams of silver(see more posts on dollar price, silver basis, Silver co-basis, )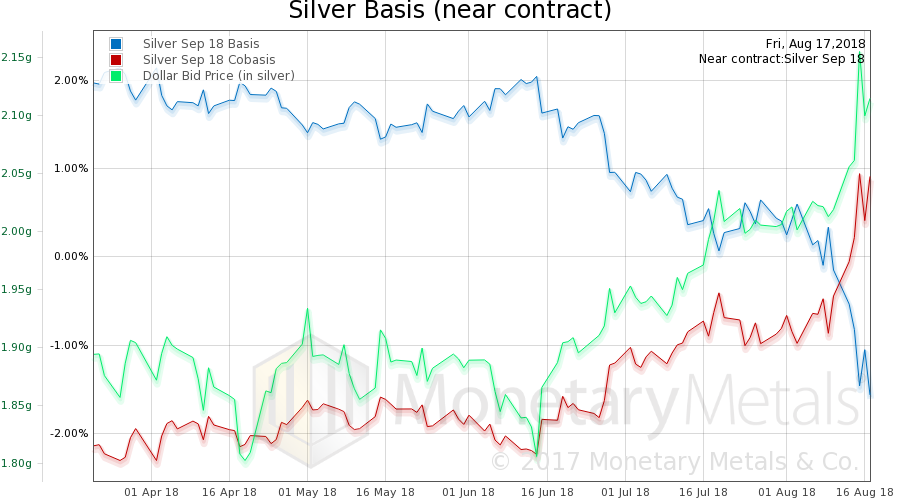 Silver basis, co-basis and the USD priced in grams of silver - Click to enlarge |
Charts by Monetary Metals
Chart and image captions by PT
Full story here Are you the author?Tags: Chart Update,dollar price,gold basis,Gold co-basis,gold price,gold silver ratio,newsletter,Precious Metals,silver basis,Silver co-basis,silver price


