


Keith Weiner
My articles My offerMy siteAbout meMy videosMy books
Follow on:LinkedINTwitterSeeking AlphaFacebookAmazonGoogle +
Last week, we discussed the tension between forces pushing the dollar up and down (measured in gold—you cannot measure the dollar in terms of its derivatives such as euro, pound, yen, and yuan). And we gave short shrift to the forces pushing the dollar down. We said only that to own a dollar is to be a creditor. And if the debtors seem in imminent danger of default, then creditors should want to escape this risk. The dollar is not redeemable so there is no way to be paid in full for the debt represented by the dollars. The only way to opt out of credit risk entirely is to trade one’s credit paper for gold. That is to buy gold. We said that Federal Reserve insolvency is not imminent.
And then we went on to the case for a rising dollar. It was good timing, as the dollar went up from 25.7 milligrams of gold to 26.5 by Thursday (that’s a drop from $1,210 to $1,175 for those of you who insist on measuring steel meter sticks with rubber bands, lighthouses from the decks of ships that are slowly sinking in stormy seas, and gold in dollars).
Traders’ Consensus
This week, Keith sat at a table with a hedge fund trader. The trader does not think of gold as money, is not into gold other than as a trade along with all other asset classes, and probably would not describe himself even as a libertarian or Austrian. He is, however, very smart and very good at what he does.
He shared that he had recently been with a group of his peers and they were all discussing the monetary system. As he presented the consensus of that group of traders, a thought struck Keith. We will get to that in a moment.
After the crisis of 2008, the central banks lowered interest rates enabling governments and everyone else to go deeper into debt. However, that debt is now a problem. These traders’ view is that gold is going down now, and it will continue to go down, and then we are headed into a repeat of 2008, except this time will be worse. The next crisis will be a debt crisis including sovereign debt. Like in 2008, every asset will go down. Gold will go down with all other assets, though less. Afterward, gold will rocket up 10 or 50 times.
These are not goldbugs talking about a $12,000 to $60,000 gold price, but conventional finance guys. They are positioning themselves now for this kind of move already, as they don’t know the timing.
This thesis mostly makes sense to us (last week we argued for pressures pushing the dollar up in the intermediate term, at least against other irredeemable currencies if not gold). And we believe that this really is the mainstream consensus. Outside the gold community, people extrapolate recent price trends and they see commodities like copper falling. And they think “right, this will continue for all commodities including gold”. Plus if there’s another crisis, precipitated by rising rates, the easy thing is to expect a repeat of last time.
If Everyone Moves to the Starboard Side of the Boat
Keith’s thought is that in markets, when everyone expects a certain outcome—then the opposite outcome is likely to occur. So let’s spend more than four paragraphs discussing how it might not work out the same way this time.
Caveat: no one knows what any price is going to be in the future—especially during and after a highly non-linear event. Traders are good at spotting a pattern and profiting from it. They are not necessarily expert at predicting a discontinuity that leads to a new pattern. We don’t claim to know the timing of the next crisis (though lots of things point to it coming sooner than later), nor the path of the price action.
In a banking crisis, prices of assets drop because everyone is suddenly desperate for liquidity. They need to get their hands on the currency in which their debts are denominated. They may not want to sell real estate or gold, but they have little choice. This problem is experienced by those who have leverage, and in proportion to the degree of leverage.
Leveraged Gold OwnersSo our first question: do those who own gold today have a lot of leverage? We know in 2008 they did, as the price dropped from over $1,030 in March 2008 to $700 in November, or -30%. And we know something else. For years prior to $1,030 in March 2008, the price had been rising. It was an obvious long-term bull market, with a few 10% pullbacks (sound like another market today?) Based on this, we infer that lots of people used leverage to own gold, and many likely borrowed against their gold. We do not refer here to those who buy futures contracts with leverage. But let’s look at that for a moment, at a picture showing 2004 to 2008. We do see a rise in the basis beginning 2H 2004, and lasing for two years. This coincides with a drop in the dollar from around 77mg gold to under 50mg (i.e. the price of gold in dollars rose from about $400 an ounce to around $600). Since basis = future – spot, a rising basis with a rising price tells us that the market is driven by increasing buying of futures relative to metal. Next, the basis is pretty flat while price is flat up through August the following year. Then the dollar begins to drop, hitting a low of 31mg (i.e. that $1000 high) by March of 2008. Interestingly, the basis is dropping while the dollar is dropping, which shows the next three months were driven by buyers of metal, not futures. |
Gold Basis Continuous, 2004-2008(see more posts on dollar price, gold basis, Gold co-basis, )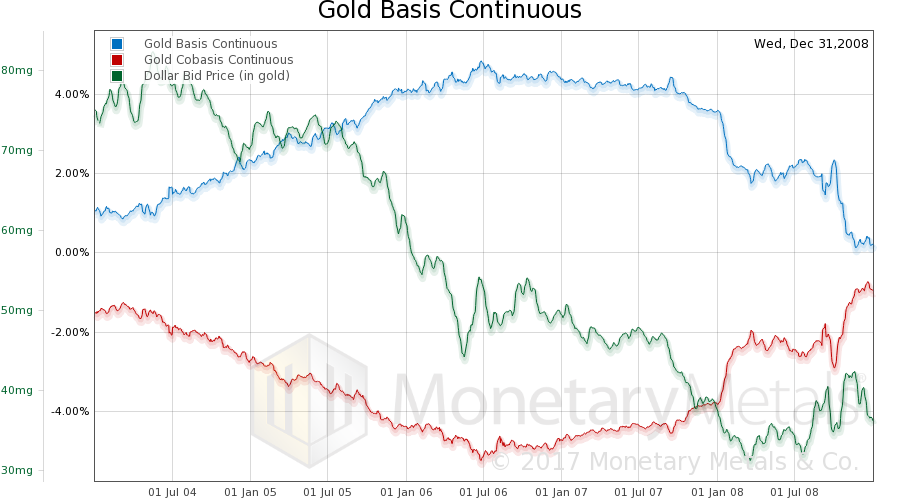 - Click to enlarge |
Gold Backwardation in 2008After that, the dollar begins to rise and the basis continues to fall, showing that liquidation in futures is driving the price. There are likely margin calls in the futures market. The February ‘09 gold contract went into backwardation on Friday Dec 12, 2008 which worsened on Monday Dec 15, before subsiding for the time being. As a historical footnote, this is the first instance of gold backwardation except for one day, Oct 5, 2000 during the episode known as “Brown’s Bottom”. It was not to be the last, as we saw backwardation recur many times subsequently. Getting back to our analysis, this backwardation shows the rising demand for metal. And during this time, the dollar fell 2mg. We will get back to why people were buying metal, i.e. exchanging their credit slips for money. Outside the futures market, there were certainly margin calls all over the place. For example, Bear Stearns failed in March 2008. What was Bear doing with mortgage backed securities and other assets? What trade were Bear’s counterparties engaging in? What were its shareholders and account holders doing, perhaps under duress? The word rhymes with “felling” and begins with the letter “s”. This period shows the tension we described last week. Some market participants are forced sellers of gold, while others are choosing to hold money (i.e. gold) rather than credit instruments which they fear will default. In 2008, we now know that the price of gold fell about 30% over seven months. This was a correction after a run-up of around 400%. |
Gold Basis Continuous, Dec.2008(see more posts on dollar price, gold basis, Gold co-basis, )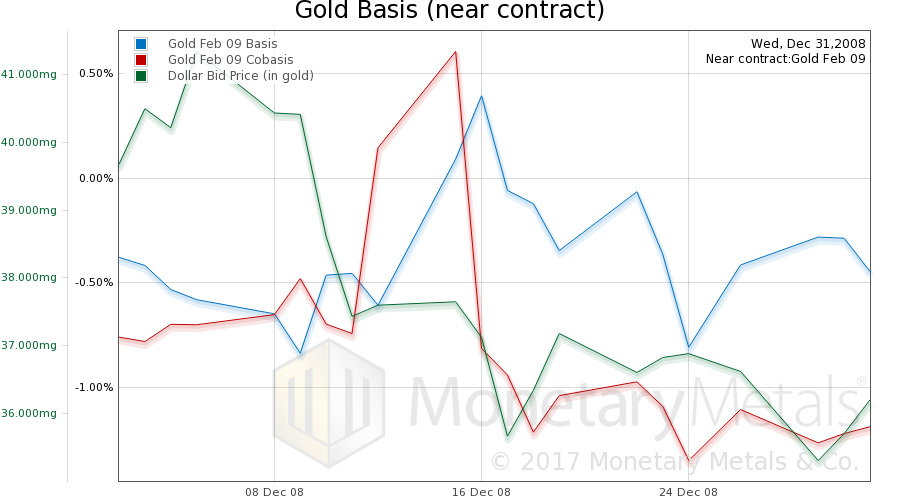 - Click to enlarge |
Differences Between Now and Then
If the crisis occurs this year, we can already see one obvious difference. There has not been a dollar bear market (miscalled a gold bull market) running for seven years. Gold is not in favor in the mainstream (if it were, the dollar price of gold would not have been sliding since the 2011 peak). And from this, we can draw three inferences. One, today gold is less held for price speculation than in March 2008. Two, where it is held for speculation, the holders likely have hedges to protect them from the downside price risk. Three, gold is probably held less in highly leveraged portfolios than it was the last time.
Another difference is that this time, everyone thinks they know how it will play out. Back in fall 2008 and early 2009, no one knew what the Fed and other central banks were about to do. Today, the glib phrase “print money to infinity” rolls off everyone’s lips, not just those in the gold community. And they know (or perhaps we should use scare quotes “know”) that first gold will go down, and then skyrocket. Last time the Fed printed (“printed”) 3.5 trillion dollars. Next time, everyone knows, it will be 35 trillion or whatever it takes. So they know gold will go down, and they know this will be the buying opportunity of a lifetime.
However, this time, gold is coming off a seven-year bear market, not a seven-year bull market. And there is one other difference today. Everyone is much more aware of the dangers of counterparty risk, and the solvency question hanging over the banking system. This does not have to be learned, new, over a period of months like it did last time. People are also thinking about cash bans (which will be necessitated when negative interest rates go below a certain threshold), capital controls, and other factors that make gold relatively more attractive. These were inconceivable in March-October 2008.
Is it just possible that this time, the price does not dip very much (or at all)? We are not going to try to predict (or perhaps we should use scare quotes “predict”) what will happen to the gold price in the next crisis. However, we would not hold our breath for gold to hit $830 (a 30% drop from today’s price). We will say this: we cannot think of any gold-bearish differences between now and 2008. The differences are all gold-bullish by comparison.
There is no certainty when it comes to what the price will do, but these trading factors—they are not fundamentals, but nor are they what we would call technicals—point to a more bullish price trajectory for gold in the next crisis, compared to the last one.
Store of Value Fallacy
And this leads us to make one final, if tangential point. We often hear people talk about gold as a “store of value”. If you have a tank, that is a store of water. A grain silo is a store of wheat. In both cases, what is being stored is a quantity of a commodity. In this sense, a vault is a store of gold.
However, economic value—as we see above—is whatever the bidder is willing to pay. Gold’s moneyness does not come from it commanding the same amount of wheat today as it did last year or 2000 years ago. In fact, its purchasing power of wheat is not fixed. Over the last ten years, pricedingold.com shows that wheat has ranged from about 0.9 grams gold per bushel to 3.6g. The highest price during this time is 4X the lowest.
One reason for gold’s moneyness is that we value the next ounce of gold—the marginal ounce—the same as the last one. Proof of this extraordinary claim is observed in the extraordinary fact that virtually all gold ever mined in 5,000 years of human history is still in human hands. Gold is not produced to be consumed, but to be held. And we keep on producing, regardless of how much has already been produced.
In other words, we measure the value of gold like we measure the value of all other things in the economy—in gold. Gold does not have constant purchasing power (perhaps we should use scare quotes “purchasing power”). It has a constant price. The price of gold is always 1. This is not expressing a tautology. It is expressing that gold has constant marginal utility.
Gold is the steel meter stick of measuring economic values. Even if we climb in elevation (quantity) the meter (ounce) does not shrink.
A giant step toward the gold standard may occur in Nevada. The state has pending legislation to issue a gold bond. Keith has put up a petition, and is asking for everyone who cares about honest money to show Nevada that you support their move to gold bonds. Please click here for the petition at Monetary Metals, especially if you would consider buying a gold bond. If you’d like to sign, but prefer not to give us your email address, please click here for the petition at Change.org.
Supply and Demand FundamentalsThis week, the lighthouse went down 24 meters (gold went down $24), or 50 inches (if you prefer, silver went down 50 cents). However, let’s take a look at the only true picture of supply and demand. Are the fundamentals dropping with the market price? We will look at an updated picture of the supply and demand picture. But first, here is the chart of the prices of gold and silver. |
Gold and Silver Price(see more posts on gold price, silver price, )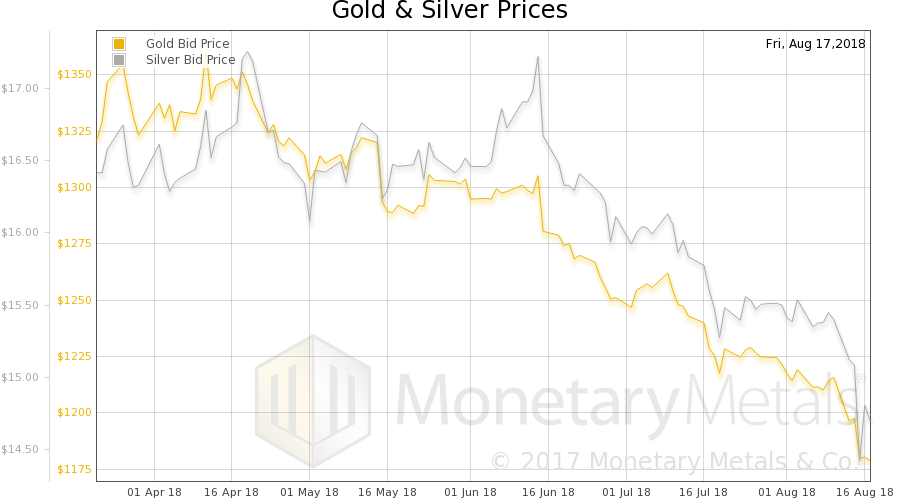 Gold and silver priced in USD - Click to enlarge |
Gold:Silver RatioNext, this is a graph of the gold price measured in silver, otherwise known as the gold to silver ratio (see here for an explanation of bid and offer prices for the ratio). It rose this week. |
Gold:Silver Ratio(see more posts on gold silver ratio, ) - Click to enlarge |
Gold Basis and Gold Co-basisHere is the gold graph showing gold basis, cobasis and the price of the dollar in terms of gold price. We see the big move up in the dollar (ok, ok, down in gold if you insist on thinking in such terms!). And with it, a rise in the cobasis (i.e. scarcity of gold). Unlike the market price, the Monetary Metals Gold Fundamental Price did not move that much. While the market price fell $24, the fundamental price fell $8, from $1,303 to $1,295. barely moved also, down $1 this week to $1,303. However, this is notable. Let’s look at an updated chart of the gold fundamental price, going back to April 2017. |
Gold Basis and Gold Co-basis(see more posts on dollar price, gold basis, Gold co-basis, )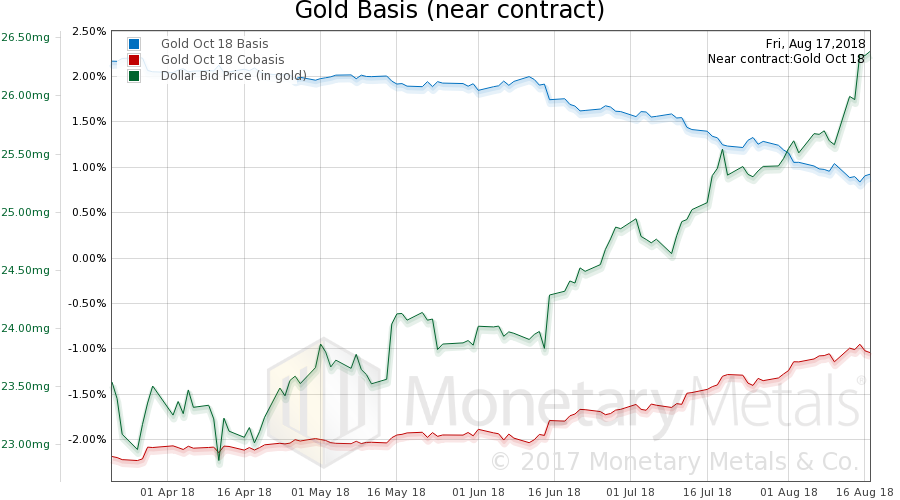 Gold basis, co-basis and the USD priced in milligrams of gold - Click to enlarge |
Silver Basis and Co-basisNow let’s look at silver. With this drop in price (and as the Sep contract rapidly approaches expiry, and hence is under selling pressure, causing falling basis and rising cobasis) we see the Sep silver cobasis has risen above zero—backwardation. Farther months are not so dramatic, but the same move occurs. The Monetary Metals Silver Fundamental Price fell only 4 cents, $16.23 to $16.19. Pretty remarkable for a week when the market price dropped so much. The fundamentals of gold look pretty firm and that of silver may be firming up here. © 2018 Monetary Metals |
Silver Basis and Co-basis(see more posts on dollar price, silver basis, Silver co-basis, )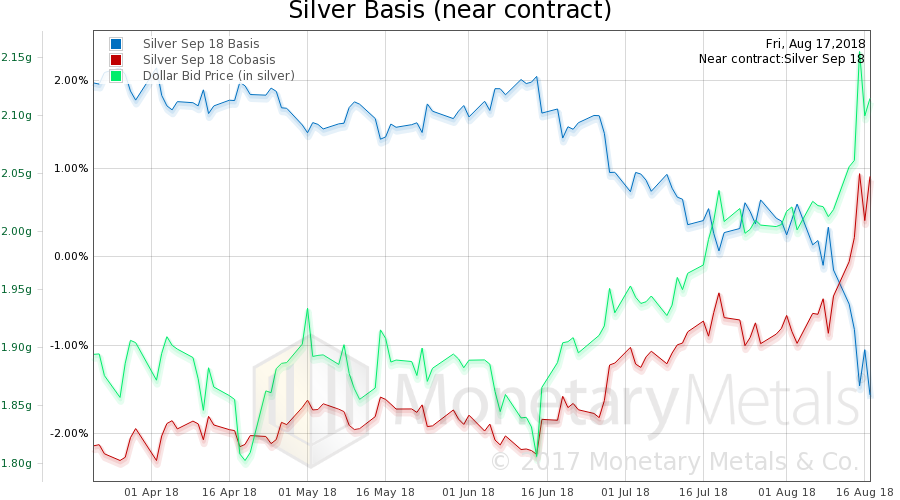 Silver basis, co-basis and the USD priced in grams of silver - Click to enlarge |
Tags: Basic Reports,credit,Crisis,default,dollar price,Gold Backwardation,gold basis,Gold co-basis,gold price,gold silver ratio,newsletter,silver basis,Silver co-basis,silver price


