


Keith Weiner
My articles My offerMy siteAbout meMy videosMy books
Follow on:LinkedINTwitterSeeking AlphaFacebookAmazonGoogle +
Last week in Monetary Paradigm Reset, we talked about the challenge of explaining a new paradigm. We said:
“The hard part of accepting this paradigm shift, was that people had to rethink their entire view of cosmology, theology, and philosophy. In the best case, people take time to grapple with these challenges to their idea of man’s place in the universe. Some never accept the new idea.”
We were talking about the fact that money is the unit of account, and the assertion that irredeemable paper currencies are money.
Monetary RelativityThis week, Turkey provides an opportunity to discuss this in a way most people can relate to. Their currency, the lira, has been falling for years, but the rate of its plunge accelerated dramatically this week. It closed last week at 19.6 cents, but on Friday it was 15.5. This may not seem like a lot, but those 3.1 pennies are about 21 percent. In a week! |
Lira in dollar, 2017-2018 - Click to enlarge |
| However, if the lira is money, then this is just our American bias speaking, isn’t it? To a Turk, the dollar closed last week at ₺5.08 and this Friday at ₺6.43, or a gain of 27%. Those who hold dollars in Turkey just got rich, right?
Which graph is objective? Most people can see the principle clearly when it comes to the toilet-paper currency of a failing dictatorship. They wouldn’t say that the dollar is up 27%. The theory of currency relativity is not applied to this case. It’s only with the dollar (and other major currencies) that things somehow become less clear. Did gold go down this week, or did the dollar go up? Everyone knows that the Federal Reserve strives to devalue the dollar at two percent per year. And they know that gold has been prized as money for thousands of years. Yet, when it comes to gold and the irredeemable dollar—they say that it’s gold which moves. |
Dollar in lira, 2017-2018 - Click to enlarge |
It’s obviously absurd to measure the dollar in terms of the Turkish lira. The lira is falling. Now, apply that same logic to the attempt to measure gold in terms of dollars. Take as long as you need.
The dollar went up from 25.61 milligrams of gold last week, to 25.7mg on Friday. Or, in silver terms, the dollar went up from 2.02 grams to 2.03g.
It’s more comfortable to say that gold went down $4. That doesn’t force one to confront any deeply-held beliefs about money. But back to a theme we touched last week, the pre-Copernicus theory of the planets had to explain their apparent retrograde motion. What could make them seemingly stop in their orbits, move backwards for a while, and then forward again?
The currently-prevailing view of the dollar as money, has its own Medieval retrograde motion to explain.
Why Is Gold Going Down?
How the #$%&! could gold possibly be going down?!?
The Fed has long abused the dollar. Consumer prices, if not commodities prices, are rising. Shouldn’t gold go up to respond to Fed abuse, if not to keep up with inflation?
There is a popular theory to explain why gold is going down: a massive price-suppression scheme. Gold, in this view, is kept down by central banks who are surreptitious selling gold and keeping it on their books as swaps.
We must ask, if this is so, then what of silver? The central banks haven’t got any silver. So if they are suppressing gold, but not silver, then silver would be much higher. How do you explain a gold-silver ratio of nearly 80 to 1?
So there is another explanation of suppression, that the banks sell paper futures. At least, it is true that such a scheme would equally apply to silver as to gold. However, Monetary Metals has proven in our Thoughtful Disagreement with Ted Butler that this is not occurring. In brief: if we look at how each futures contract behaves as it heads into expiration, we can determine if the banks are naked short. Monetary Metals has the data on every contract going back to 1996, and we share the data in that article.
Gold is money and the dollar is the much-abused irredeemable credit of the Federal Reserve, backed by the irredeemable credit of the US Treasury. Gold is not going anywhere, it’s the dollar which moves. At the moment, it is going up. Since April 19, the dollar has gone up about 2.58mg of gold.
What Is Causing the Dollar to Rise?
We see a tension between two opposing forces, one pushing the dollar down and the other pushing it up. The countertrend of rising interest rates of the past few years applies both downward and upward pressure.
Downward pressure on a currency is simple. If debtors use a lot of short-term bonds or even overnight borrowing to fund themselves, then they feel every uptick in rates immediately. Their interest expense goes up. And, after decades of falling rates, debtors have been well-trained to use short-term debt where possible.
The debtors, including the government, get weaker. If creditors believe that default risk is rising, then they sell the currency. If it happens to all currencies at the same time, then investors may decide it is better to own gold than to be a creditor in any irredeemable currency.
The Fed has certainly been abusing its credit, including taking on directly and indirectly exposure to debtors who are getting weaker. However Federal Reserve insolvency, to paraphrase our old buddy Aragon, is not this day.
NB: we do not cite rising quantity of currency units as a force pushing a currency down. In an irredeemable currency, quantity must always rise exponentially. However, there are times when the value rises.
Turning to upward pressure on the dollar, its rising rate is making it less and less attractive as funding for carry trades (i.e. borrowing source currency, selling it short to buy another currency, and buying an asset in that currency). Instead, it makes the dollar more attractive for everyone worldwide to hold.
For example, the low yield (so far) set in the 10-year Treasury was on July 10, 2016. On that day, the bond paid 1.366%. Over the last two years and one month, the yield increased to 2.857%. It has gone up about 150 basis points (that’s 109 percent, by the way!) In the same time, the German 10-year bund went up from -0.184% to 0.321% or only about 50bps. The US Treasury was more attractive to hold, than the bund, even in July 2016. However, the net result of these moves is that the Treasury’s relative attractiveness increased by 100bps.
Traders all over the world may find it more attractive to sell short other currencies to fund their purchase of Treasury bonds. That will push those other currencies.
And even weakening the debtors can push up the dollar. Government at every level, most corporations and businesses, and a great many individuals deep are in deb. Higher interest rates apply great pressure to them.
The debtors must take steps to be able to service their debts. For example, it is prudent to keep X months’ worth of expenses on hand, in cash. As the interest expense rises, this means hoarding more cash. As we will see below, there are reasons to increase the number of months of the cash buffer, too.
Another factor is that debtors will sell whatever they need to generate revenue to service their debts. We don’t mean that they necessary sell capital assets like gold (though this can happen, of course). But that they mount a relentless bid on the dollar.
As an aside, in a genuine rising-rates trend (for an example of this, see the 1950’s through 1970’s) the pressure on debtors is diminishing. They find it easier and easier to make larger and larger margins. At the same time, the temptation to borrow declines. That is, those who did not borrow at 6% are definitely not borrowers at 12%.
Today, we have a little rise in rates, but unless it provides relief from intense competition (not likely, not yet) that just means the relentless drive to generate revenues rises. This little rate hike is not providing such relief.
An Unintended and Unwanted Consequence of Tariffs
And now, enter tariffs. Tariffs are designed (from a mechanics standpoint—we do not want to debate the thought process of President Trump) to reduce the volume of goods sold into the country which imposes the tariff. In the case of US tariffs, this means it is more difficult to generate dollar revenues, for manufacturers, exporters, shipping companies, port operators, and many other businesses that serve these industries.
However, the tariff does not lower their dollar debts or debt service expense. The outcome of this squeeze is a rising dollar. These debtors will be forced to hoard their precious dollar reserves more than previously. They may even borrow more dollars, to build up their dollar cash reserves.
Of course, for every unit they cannot sell to America, they will seek a customer in another country which does not tariff their goods. And this customer will likely pay a lower price (which is why America outbid them, until the tariffs). Also, this buyer may pay in his own local currency. So the vendor must sell that currency, driving it down further, to generate the dollars needed to service its debts.
This distortion will affect every kind of good and every commodity.
Americans (in the case of US tariffs) should expect to pay higher prices for many goods, as the cost of tariffs blocks the lowest-cost producer from the market, and they must buy from higher-cost domestic producers. However, unlike in a rising-rates trend such as the postwar period, the profit margins of most producers are not rising. The net effect will most likely be margin compression, as customers are not willing to absorb an increase in prices.
However, perversely, some prices in American can fall temporarily. Certain domestically-produced goods can no longer can be exported due to tariffs imposed in China and elsewhere. So producers of those goods are piling them up in warehouses, but may be forced to dump them on the bid, whatever that bid may be. This especially applies to perishable goods like pork and soy.
In world markets, the artificially-higher costs created by tariffs necessarily mean lower volumes produced and consumed. Lower volumes mean less consumption of commodities. Look at the metal which is often touted as “having a PhD in economics”, Dr. Copper. As recently as two months ago, copper was over $3.30 per pound. It hit a low of $2.67 in July (it has bounced slightly since then).
In addition to the normal central bank induced credit cycle (if we may use so clean a word for such a dirty thing), now producers must contend with a tariff cycle on top of it. Who knows which government will do what to them next?
This is no mere rhetorical question. As producers wrestle with it, they will find more reasons to increase their hoarding of dollars, at nearly all costs.
And notice that the above described mechanisms have a positive feedback. The more their local currencies fall, the more the currencies of the countries where they can still sell their goods fall, the more desperate manufacturers become for dollars. The more the tariff policies are in play, the more it will drive other currencies down. The more that producers around the world hoard dollars as a hedge against unknowable risks from tariffs and FX rates, the more that it drives the dollar up (i.e. in gold terms) and their local currencies down.
To the extent that gold (and more likely silver) are used as raw materials in the manufacture of tariff-affected goods such as appliances or cars, this will reduce demand for them.
In the past, we have touched on one particularly perverse characteristic of our monetary system. The direct incentive pushes economic actors to do the opposite of what they ought to do, if they have a full understanding and look forward to the end game. For example, in a falling interest rate environment, each drop in the rate causes a rising incentive to borrow. If you didn’t want to borrow at 8%, how about 6% or 4%? However, having borrowed at 4%, the net present value of your debt rises when the rate drops to 2%. This perversity occurs in other areas also.
And it is occurring right here. If the US will really have a policy to discourage imports, and keep this policy, then it is stepping on the third rail (the one carrying the dangerous high voltage) of the monetary system. Economist Robert Triffin noted a dilemma, back in the 1960’s. Lots could be said, but let’s summarize it in a short sentence.
The issuer of the world’s reserve currency must run a trade deficit with the world.
Its currency is needed for the economic growth of the rest of the world. This was true of the bastardized pseudo gold standard used after WWII. It’s still true in the post Nixon gold default world of today.
So back to our point. Trump is now attempting to set a trade policy that contradicts the functioning of the dollar as the world’s reserve currency. This is not an argument that some other irredeemable currency can replace it. It is an argument that the functioning of the world’s monetary system will be impaired, to the extent that the US restricts global exports to the American market.
And that brings us back to the question where we started. Why is money (gold, as we keep reminding everyone) seemingly not in demand? Would you want to load up on the world’s reserve currency? Or would you prefer not to gamble, and hold money?
Before you answer that, be aware that a (very) perverse incentive is pushing millions of producers all around the world to load up on the reserve currency. Those who hold gold may feel a little bitter that money is seemingly not in demand.
To which, we say two things. One, give it time. What we describe cannot last forever. And, two, the above background is useful to understand the context, but not to predict the next move in the gold.
Supply and Demand FundamentalsFor that, we look at the only true picture of supply and demand in the gold and silver markets, i.e. the basis. After peaking at the end of April, our model of the fundamental price of gold came down to the level it had last November. $1,300. Which is below the level it had since Q2 2017. We will look at an updated picture of the supply and demand picture. But first, here is the chart of the prices of gold and silver. |
Gold and Silver Price(see more posts on gold price, silver price, )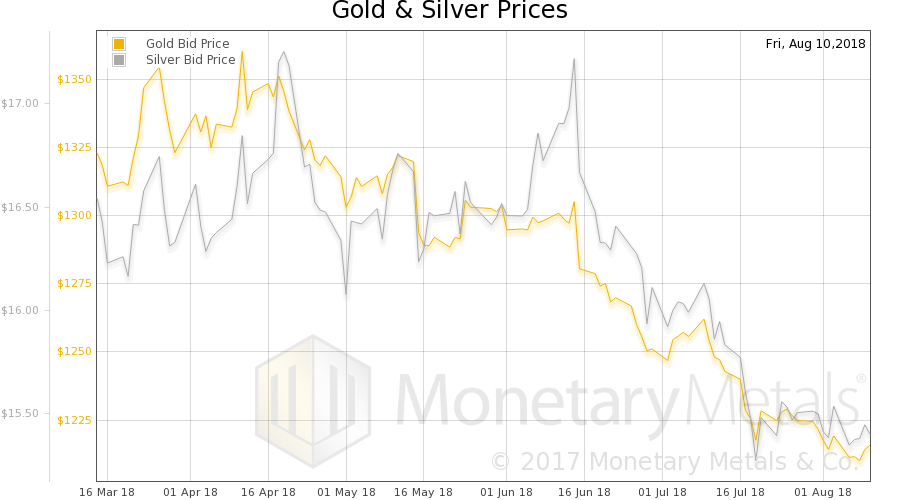 - Click to enlarge |
Gold:Silver RatioNext, this is a graph of the gold price measured in silver, otherwise known as the gold to silver ratio (see here for an explanation of bid and offer prices for the ratio). It rose this week. |
Gold:Silver Ratio(see more posts on gold silver ratio, )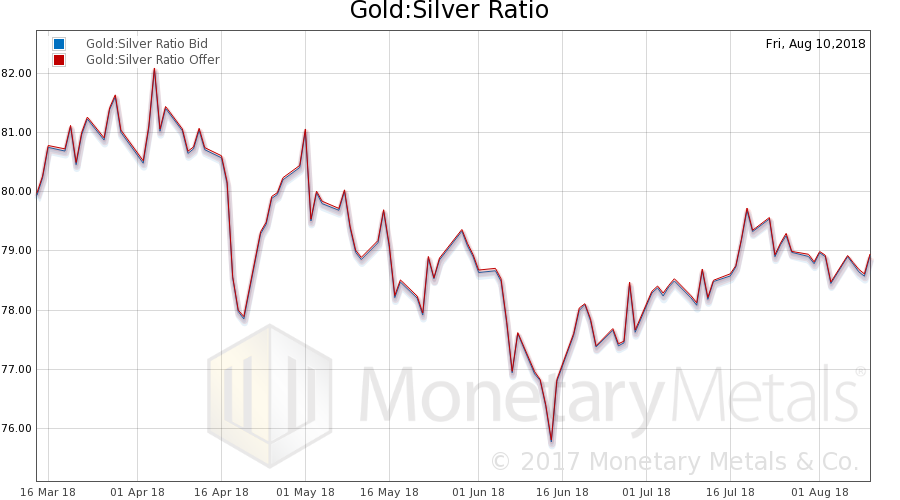 - Click to enlarge |
Gold Basis and Co-basis and the Dollar PriceHere is the gold graph showing gold basis, cobasis and the price of the dollar in terms of gold price. The price barely moved. And the basis (abundance) and cobasis (scarcity) barely moved too. |
Gold Basis and Co-basis and the Dollar Price(see more posts on dollar price, gold basis, Gold co-basis, )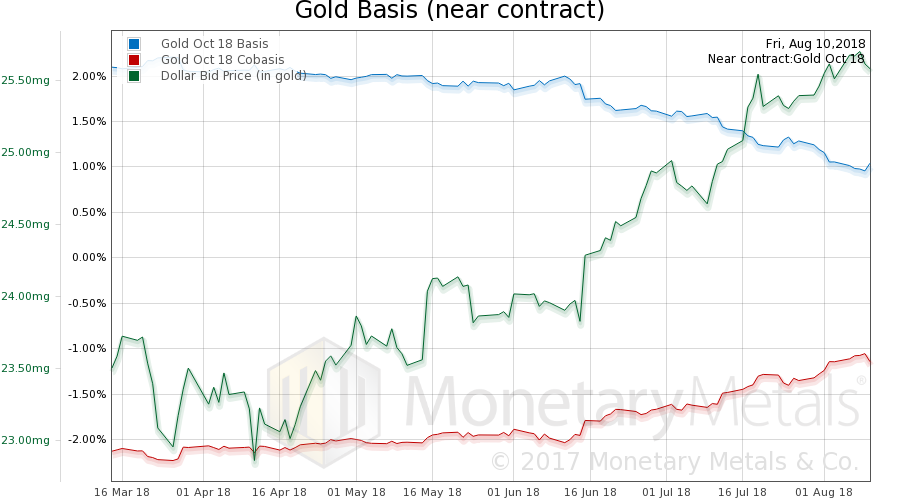 - Click to enlarge |
| And the Monetary Metals Gold Fundamental Price barely moved also, down $1 this week to $1,303. However, this is notable. Let’s look at an updated chart of the gold fundamental price, going back to April 2017.
The red arrows show the trend since the end of June. The market price has moved down about fifty bucks, in contrast to the fundamental price which has moved sideways. Obviously, this does not mean that the market price cannot go lower. And there is no guarantee that the fundamentals will hold. However, it suggests that traders now ought to be thinking of buying gold. Apart from the contrarian angle, that the price has moved down a lot—about $150 since mid-April—this is the reality of where supply of metal intersects demand of metal. Or, rather, it would be the intersection point if it weren’t for those pesky leveraged speculators who can pull the price away from this intersection. As they are now. |
Gold Fundamental Price(see more posts on gold price, )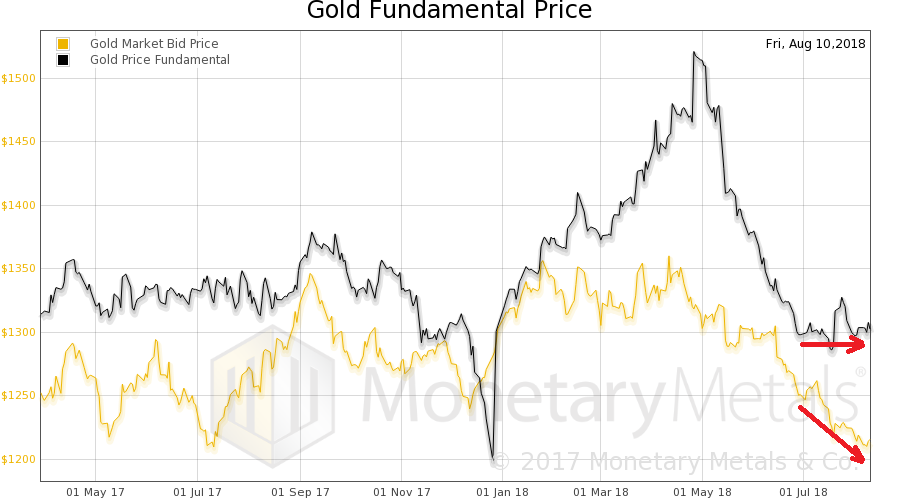 - Click to enlarge |
Silver Basis and Co-basis and the Dollar PriceNow let’s look at silver. Although the September silver contract shows a falling basis and rising cobasis, the silver basis continuous didn’t move much. However, the market price of silver dropped this week. |
Silver Basis and Co-basis and the Dollar Price(see more posts on dollar price, silver basis, Silver co-basis, )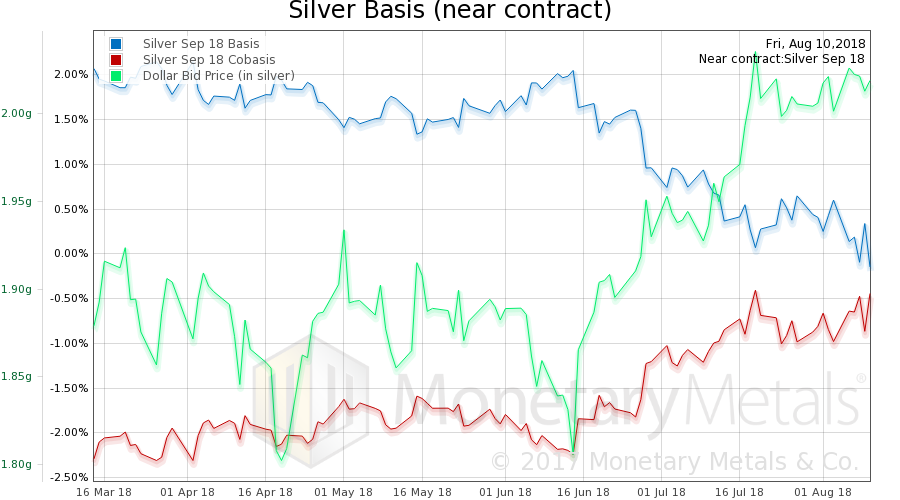 - Click to enlarge |
The Monetary Metals Silver Fundamental Price fell 29 cents, from $16.52 to $16.23, and it has been in a downtrend since the third week of May
© 2018 Monetary Metals
Full story here Are you the author?Tags: Basic Reports,dollar price,gold basis,Gold co-basis,gold price,gold silver ratio,newsletter,silver basis,Silver co-basis,silver price


