Keith Weiner
My articles My offerMy siteAbout meMy videosMy books
Follow on:LinkedINTwitterSeeking AlphaFacebookAmazonGoogle +
Let’s return to our ongoing series on the destruction of capital, and how to identify the signs. Steve Saville posted a thoughtful article this week entitled The “Productivity of Debt” Myth. His article provides a good opportunity to add some additional thoughts.
We have written quite a lot on this topic. Indeed, we have a landing page for marginal productivity of debt (MPoD) with four articles so far. Few economists touch this topic, perhaps because MPoD shows that our monetary system is failing. We encourage you to do a Google search, and you will see scant mention other than articles by Keith and Monetary Metals. This is tragic. Every monetary economist should be bellowing from the rooftops about the falling marginal productivity of debt!
So when Lacy Hunt wrote in the Hoisington quarterly letter about Diminishing Returns – Consequences of Excess Debt (p. 4), several readers forwarded the link to us. And this week Steve Saville wrote a response to Lacy’s discussion.
We have our own concerns with Lacy’s approach. One is his statement:
“In addition to capital, output is a function of labor, natural resources and technology. Thus, one of these latter three factors must accelerate in order to offset the overuse of debt…”
Unless one considers entrepreneurial innovation to be just a type of “technology”, this formulation is missing something even on its own stated terms. But more broadly, it does not address the problem of interest rates. If companies can borrow at 2%, then there will be scant business opportunities that generate more than about 3%. The marginal productivity of the entrepreneur is brought down by the falling interest rate. The same “inputs” of labor, resources, and technology will yield different results at different interest rates.
Marginal Productivity of Debt
However, today we want to address the points raised by Steve. All indented quotes below are his.
“According to Hoisington and many other analysts, the problem is encapsulated by the falling trend in the amount of GDP generated by each additional dollar of debt, or, looking from a different angle, by the rising trend in the amount of additional debt required to generate an additional unit of GDP. However, there are some serious flaws in the “Productivity of Debt” concept.”
It may seem a minor quibble, but we must say the concept is not productivity of debt, but marginal productivity of debt. The debt as such is not producing anything. At issue is the marginal dollar of debt, and how much it adds to productivity at the margin.
“There are three big problems with the whole “it takes X$ of debt to generate Y$ of GDP” concept, the first being that GDP is not a good indicator of the economy’s size or progress.”
We agree 100%, and have argued many times that GDP = production + destruction. If you pay 1,000 men to dig a useless hole, and then pay 1,000 more men to fill it in, it is true that this adds to GDP. This is not an argument in favor of digging useless holes, or Keynesian stimulus. It is a damning indictment of GDP.
GDP is a statist’s tool. Its use generally promotes statist measures (e.g. Keynesian stimulus aka pork barrel spending). It should be noted that GDP’s flaws will tend to overstate real growth in the economy, for reasons Steve cites and because the statists want to overstate it. The promise of growth is a powerful soporific. That’s one reason why so few economists are up on the rooftops bellowing about the long-term falling trend of MPoD and the eventual heat death of the economic universe (another is Andy Lees of MacroStrategy Partnership in the UK).
The economy’s a growin’, don’t’cha’ know it? Just look at GDP, up over 4% in Q2 we’re told.
In any case, GDP is what we have. And the long-term trend can tell us something, even if we take the absolute number with a grain of salt. That is the issue here: the trend of MPoD is falling.
Steve continues:
“The second flaw in the “it takes X$ of debt to generate Y$ of GDP” concept is that it involves comparing a flow (annual GDP) to a stock (the cumulative total of debt).”
Dimensional Analysis
We argue for the discipline of dimensional analysis, a principle taught to every first year student of chemistry or physics (i.e. real science). Dimensional analysis is examining the dimensions or units.
For example, distance is meters. Velocity is meters per second. Acceleration is meters per second per second, mass is kilograms, and so on. Everyone knows Newton’s famous equation F=MA. We just said acceleration is m/s^2. Therefore force is kg·m/s^2. If force were not kilogram meters per second squared, then our analysis of the units would tell us that Newton’s equation doesn’t work.
We have said many times that this is invalid: “Inflation is when too much money supply is chasing too little goods supply.” Money supply is a stocks, or tons (of gold). Goods supply is a flows, or tons per year. To compare the two is like comparing the speed of your car to the distance between Keith’s house and the Arizona capitol. Note that this might be an interesting comparison, if you want to know how long it will take you to arrive at his house.
Quantity Theory of Money
Dimensional analysis raises a flag. It says there is something we ought to examine closer. Of course, the proof that QTM is wrong involves more than simple as dimensional analysis. To prove QTM false, we need to understand economics at a deeper level.
For example, money is not consumed after a transaction, but goods such as pork bellies and copper ingots are. Money is not directly comparable to goods.
Another example is that people don’t want to spend their savings, but their income. That is, they spend not their stocks, but their flows. Go out and observe millionaires who have an annual income below $50,000. They are usually very frugal. You will see many of them at the Golden Corral all-you-can-eat restaurant, coming in for a late lunch. They want the $8.19 price, before it goes up to $11.49 for dinner, and of course a late lunch lets them combine two meals into one for more savings. Who are these millionaires with modest incomes? Senior citizens. They want to live within their incomes (harder and harder, as the interest rate has fallen over the past 37 years).
Another flaw with QTM is that it does not realize that businesses borrow for a productive purpose, to finance new production. If heavy equipment manufacturers borrow to buy more machines to build more tractors, we should expect the price of tractors to drop, not rise. If farmers see this, and also a drop in the interest rate, and they borrow to buy tractors to increase crop yields, we should not expect the price of wheat to go up, but down.
Consider Acme Inc. The company borrows $1,000,000 to buy machines that stamp out widgets. It sells those widgets at a profit sufficient to amortize the loan plus leave something over for the shareholders. Acme management must make a direct comparison between its profits and its debt to finance the machines. Its profits are a flows, and its debt is a stocks. Its debt literally enables its profits.
This is the basis for the direct comparison of change in GDP to change in debt. There is supposed to be a relationship. If there isn’t, then the whole basis of business and finance is wrong!
Since it’s not wrong, let’s proceed.
The concept of marginal productivity of debt is adding a dollar of debt, increase GDP by, say, 30 cents.
Comparing Stocks to Flows
Steve says MPoD is “…comparing a flow (annual GDP) to a stock (the cumulative total of debt).” But this is incorrect. We are not looking at the cumulative total of debt. We’re looking at the change in debt during the year.
Cumulative total of debt is a stocks, of course. That is not what we are looking at. We are looking at change in debt, which is borrowing. Borrowing is a flows.
What else is a flows? The debt service. In theory this is amortization plus interest (even if many borrowers are not amortizing). Every dollar of debt implies a flows—the income necessary to amortize it over a finite period. Even if the Fed pushes interest to zero, there is still amortization. What if each new borrowed dollar of debt can only be amortized over a longer period of time than the previous?
This is a key reason why MPoD matters. We can’t add debt without worrying about the income to service it. GDP may be a poor proxy for income, but our current point is that dimensional analysis of MPoD checks out.
Moving on, Steve states the third problem:
“In any case, the above two flaws in the typical productivity-of-debt analysis pale in comparison with the third flaw, which is that the entire concept of debt productivity is meaningless. The fact is that debt doesn’t cause economic growth and ‘excessive debt’ (whatever that is) doesn’t inhibit economic growth.
An economy can grow with or without an increase in debt, because per-capita economic growth is caused by savings and capital investment. An increase in debt can accelerate the pace of real growth by acting as a means by which savings are channeled to where they can be invested to the best effect, but the transfer of savings can also occur via the exchange of money for equity. For example, most exploration-stage mining companies and most technology start-ups are equity-financed not debt-financed. There is, of course, debt that is used to finance consumption rather than investment, but that type of debt can’t grow the economy over the long term because it necessarily involves a present-future trade-off — more spending in the present leads to less spending in the future.
The central problem is unsound money, not excessive debt.”
We agree. Of course debt does not cause growth. Just as flour does not cause bread. Wheels do not cause a car to drive. They are necessary, but not sufficient (an underappreciated idea in economics and beyond the field). If you doubt that borrowing is necessary, just imagine opening a humble hamburger restaurant.
We also agree that not all growth comes from debt. Steve discusses another kind of investment, equity capital. And we would add that some firms reinvest their own profits to finance growth. So the problem is even worse than MPoD suggests. We are getting GDP growth from both debt and non-debt financing. But MPoD compares total growth to debt financing only. Therefore the problem of falling marginal productivity of debt is actually understated.
Steve notes that, “There is, of course, debt that is used to finance consumption rather than investment, but that type of debt can’t grow the economy…” Quite. And also debt used to pay the interest on previously-incurred debt. This is the problem which motivates us to unlimber that ladder to climb up to the rooftops to bellow about MPoD.
The end of our citation (Steve says more) brings up an essential point.
Nixon removed the money (gold) from the monetary system. Since then, we have used irredeemable credit as if it were money. Whatever its virtues real or imagined, Irredeemable credit cannot perform one key function performed by money. It cannot extinguish a debt. When you pay a debt using a credit, you merely shift the debt.
We pronounce a dire warning: debt necessarily grows exponentially. The system is unsound because it breeds debt, not because of rising prices.
Supply and Demand Fundamentals
The price of gold dropped $8, and that of silver 4 cents.
There is an interesting feature of our very marvel of a modern monetary system. We have written about this before. It sets up a conflict, between the perverse incentive it administers, and the desire to protect yourself in the long term.
Consider gold. Many people know they should own it. They know that governments are profligate borrowers (even if they don’t understand the diminishing returns of borrowing, aka Marginal Productivity of Debt). They know that governments haven’t got the means or intent to repay. They realize that the dollar (and euro and pound, etc.) are just slices of government debt. And they don’t want to be creditors to government.
Yet, buying gold seemingly does nothing for them. Unless its price is rising—which it clearly isn’t at the moment—what good is it? And, they ask a more pointed question. If governments are all heading toward default, why isn’t the price of gold rising? Wouldn’t there be a mad rush for gold as government paper is repudiated? Yes, of course, when that repudiation happens. But quoth Aragorn, “today is not that day.”
Today, why should there be a gold rush? The rushers (aka the herd) want to jump on whatever asset is going up. Not so much whatever asset promises to protect them from Aragorn’s “not that day”.
Further, if some do rush in and push the price up, then a different crowd springs into action. Those who have realized a gain in their purchasing power. They sell.
Today, we must all seek to generate returns however we may. And those returns are dollars, to pay for Budweiser and the F-150 payment, or Cristal and Gulfstream 650s, as the case may be.
We know that at some point in the future, not tomorrow and not this year, but some point, the time for being a government creditor will over. Their unpayable debt will come tumbling down, and with it the currencies back by this debt.
But today is not that day. Today, we want to know when gold will have another run up. The price hit a high of $1365 in early April. Now it’s over $140 lower. That’s no fun (even for us).
We have documented the epic rise in the gold fundamental price (which continued to rise through the end of April) and then collapse back in line with the longer-term trend. Look at this graph:
| Since the low price hit around the start of 2016, the black line (fundamental price) shows some cyclicality. And, we read it as a generally rising trend. Certainly the bottoms (if indeed the bottom was hit on July 19) are each higher than the last (except Dec 2016). |
Gold Fundamental Price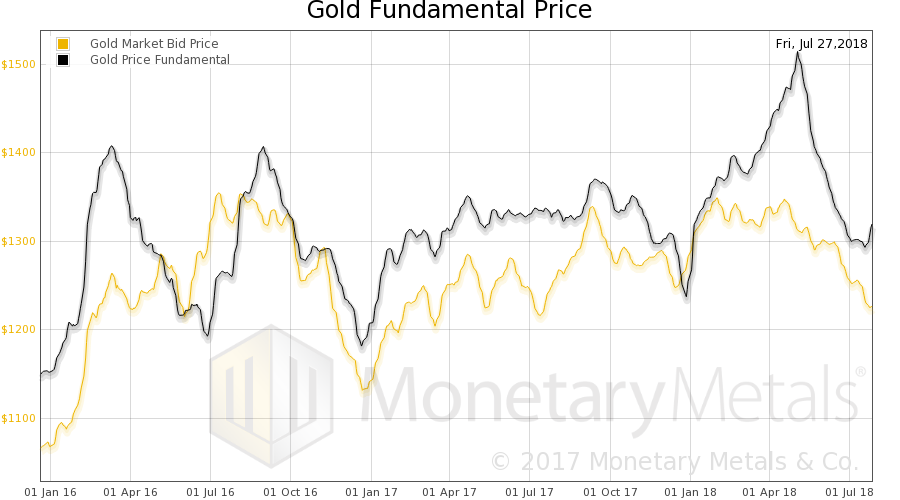 - Click to enlarge |
Gold and Silver PriceBelow, we will provide a picture of the changing gold and silver supply and demand pictures. But first, here is the chart of the prices of gold and silver. |
Gold and Silver Price(see more posts on gold price, silver price, )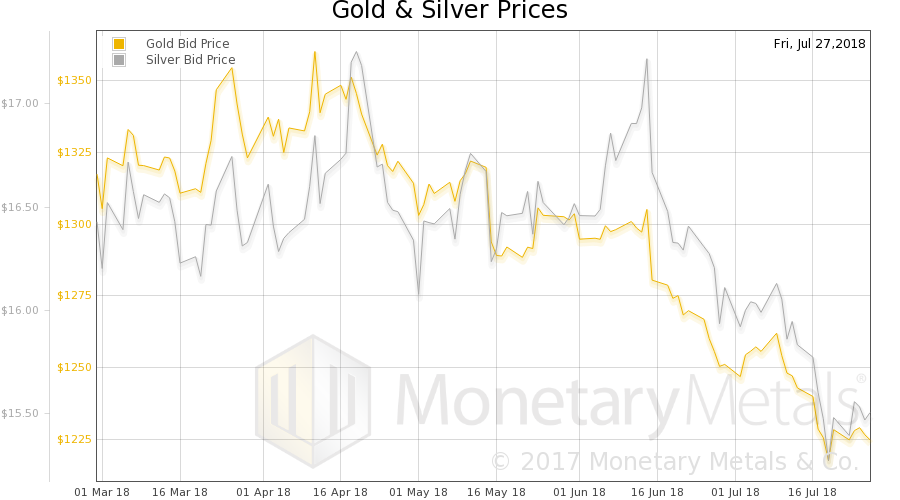 - Click to enlarge |
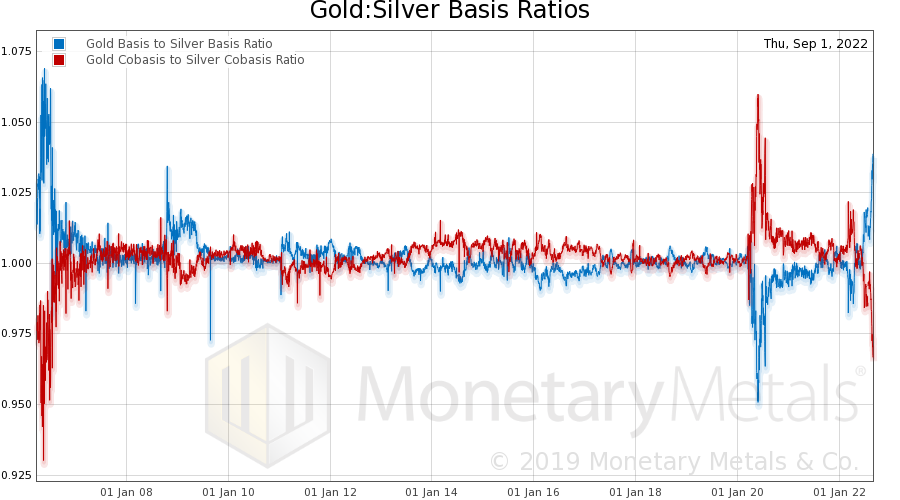
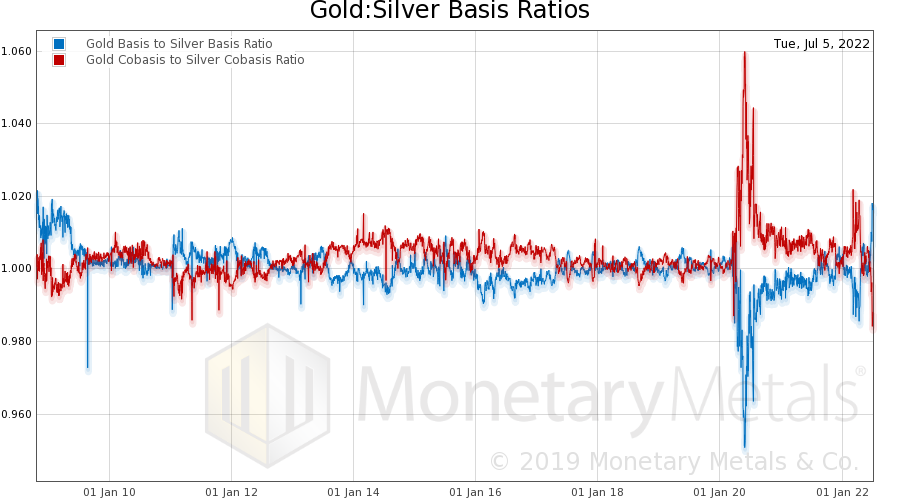
Gold: Silver RatioNext, this is a graph of the gold price measured in silver, otherwise known as the gold to silver ratio (see here for an explanation of bid and offer prices for the ratio). It fell this week. |
Gold: Silver Ratio(see more posts on gold silver ratio, )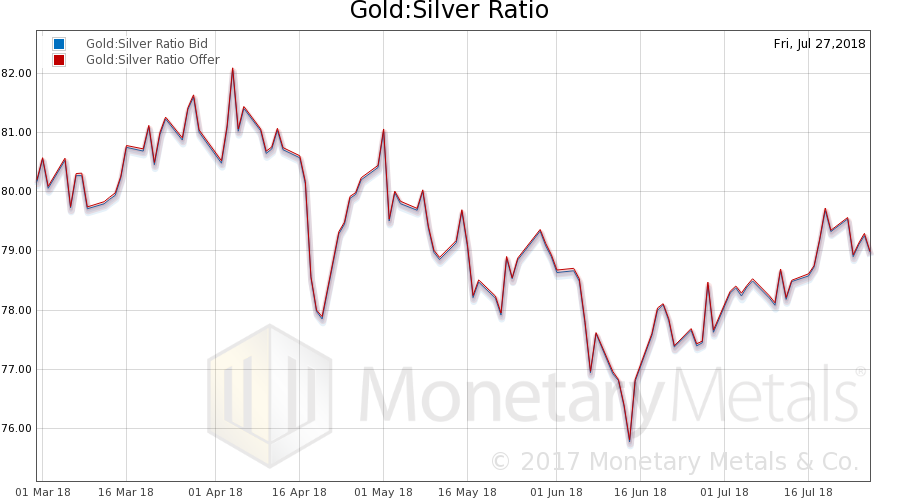 - Click to enlarge |
Gold Basis and Co-basis and the Dollar PriceHere is the gold graph showing gold basis, cobasis and the price of the dollar in terms of gold price. The price didn’t move a lot, and neither did the basis. The Monetary Metals Gold Fundamental Price went down $7 this week to $1,309. |
Gold Basis and Co-basis and the Dollar Price(see more posts on dollar price, gold basis, Gold co-basis, )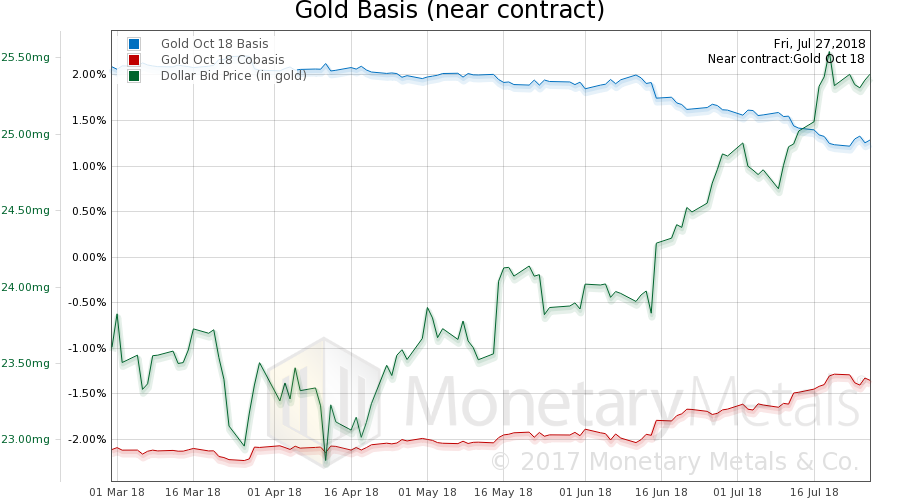 - Click to enlarge |
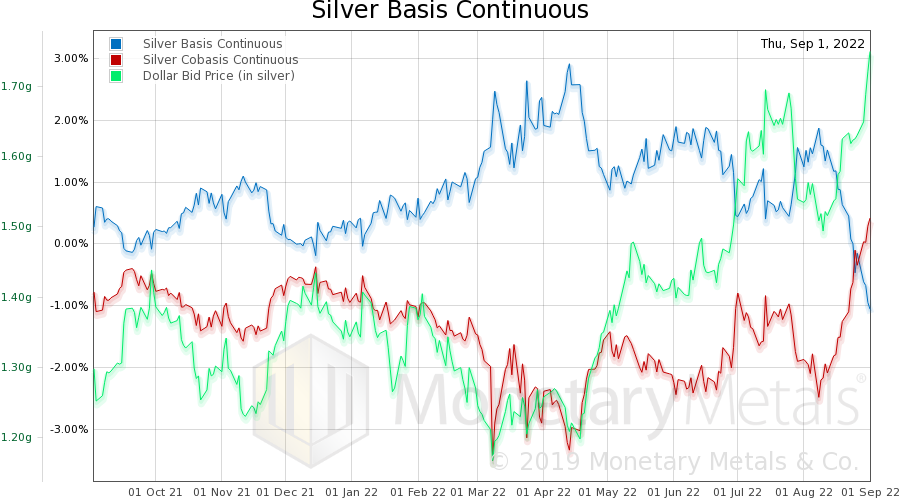
Silver Basis and Co-basis and the Dollar PriceNow let’s look at silver. Silver has basically the same picture. |
Silver Basis and Co-basis and the Dollar Price(see more posts on dollar price, silver basis, Silver co-basis, )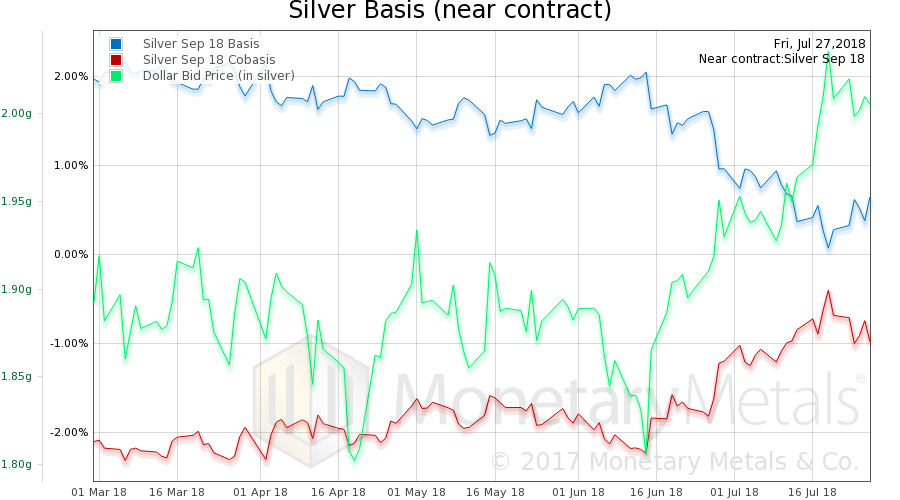 - Click to enlarge |
The Monetary Metals Silver Fundamental Price fell 50 cents, to $16.72.
© 2018 Monetary Metals
Full story here Are you the author?Tags: Basic Reports,dollar price,gold basis,Gold co-basis,gold price,gold silver ratio,marginal productivity of debt,newslettersent,silver basis,Silver co-basis,silver price