Pater Tenebrarum
My articles My siteAbout meMy videosMy books
Follow on:TwitterSeeking AlphaFacebook
Technical Divergence Successfully MaintainedIn an update on gold and gold stocks in mid June, we pointed out that a number of interesting divergences had emerged which traditionally represent a heads-up indicating a trend change is close (see: Divergences Emerge for the details). We did so after a big down day in the gold price, which actually helped set up the bullish divergence; this may have felt counter-intuitive, but these set-ups always do. Consider now the updated chart below (we have added the HUI-gold ratio in the third panel of the chart, as it provides additional clarity). |
 Everybody has different reasons for wanting to buy or hold gold – this is actually a fairly good one… 🙂 |
| As the chart illustrates, after our update gold and gold stocks continued to head down for almost two weeks, but readers watching the sector no doubt noticed that: 1. gold stocks declined only reluctantly and the sector exhibited internal strength (i.e., even on down days, numerous stocks managed to gain ground) and 2. the divergences we discussed remained in place.
Since then, there was a minor bounce in the gold price from a lateral support level created by the December 2017 low, but the relative strength in gold stocks has continued to increase, which is a clear change in character. The HUI-gold ratio even managed a kind of “breakout” by moving above a lateral support-resistance line formed by a previous low and two previous highs (to the extent that one can even speak of “support and resistance” with respect to ratio charts, which is debatable). Note that the HUI-gold ratio was in a fairly strong downtrend for more than six months before bottoming – very quietly – in mid March. Obviously, not every upturn in the ratio will lead to a significant trend change. The ratio often expands in the short term in the course of gold price rallies such as in the rather disappointing seasonal rally that began in mid-December. In that case it was actually the weakness of the expansion in the ratio that proved to be a heads-up. The recent case is different, as the ratio has begun to strengthen noticeably in a time of weakness in gold and silver prices. Having said that, the HUI index itself is now facing overhead resistance both from previous price highs and in the form of its still declining 200-day moving average. While prices have moved above the 50-day and 20-day ma, the latter has not even crossed back above the former yet, and both have only just begun to flatten out. If one squints a bit, one can see minor divergences between the index level and the RSI and MACD oscillators. All in all, the recent advance still looks a bit dubious from a technical perspective. |
Gold, the HUI index and the HUI-gold ratio - Click to enlarge Gold, the HUI index and the HUI-gold ratio – it was a “close shave”, but the HUI did not violate its previous low and the divergence with gold was therefore maintained. This is even more obvious in terms of the HUI-gold ratio, which would have made a higher low even if the index had not. |
| It would therefore not be a big surprise if the recent rally were to stall out near current levels and was followed by another consolidation phase before a breakout attempt. A successful breakout above lateral resistance and the 200-day ma is ultimately required to confirm the positive message from the divergences at the recent lows.
Per experience, the more forceful such a confirmation is, the more reliable it will be – this refers specifically to the moment of confirmation, regardless of its precise timing. Considering the lengthy bottoming period from mid-2015 to early 2016 (and other historical examples) one has to be mentally prepared for the possibility that it could take a few more weeks or even a few more months before a new medium term uptrend emerges, but it could just as well happen right away. For long-term oriented investors this should be irrelevant (unless one has the patience of a Zen master, one should not be dabbling in this sector anyway), but short term traders have to be vigilant, as a potentially worthwhile opportunity continues to be in its formative stages. |
HUI daily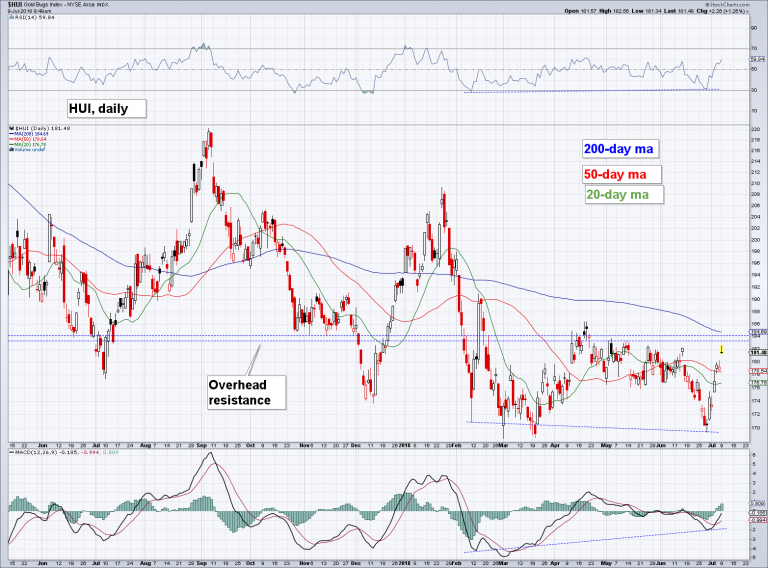 - Click to enlarge HUI daily, with moving averages and near term lateral resistance penciled in. Mildly positive divergences with oscillators are in evidence, but major resistance still has to be overcome. Note: when it finally happens, it will happen fast. At that point it is usually best to abandon any remaining reservations. |
A Positioning ExtremeApart from the improving HUI-gold ratio, there is another signal that indicates that traders should be on alert. Since 2007 the CFTC is publishing disaggregated commitments of traders data in addition to its legacy CoT reports. We are keeping an eye on the “managed money” category in this report, which primarily consists of speculative trend followers (mainly CTAs and hedge funds). This group has held a net short position in COMEX gold futures on just three occasions in the entire history of the report. Two of those were recorded in 2015 – one in the middle of the year and one right at the December low, after which a scorching rally ensued (in about 6 months gold rallied by around $330 from its low, the XAU gained 200% and the HUI 180%). Due to last week’s holiday the most recent update is already a bit dated (June 26), but it was just the third time the “managed money” group went net short in the aggregate – if only by a handful of contracts (on the chart below the net position is stated as “0”, but in fact it was net short by 24 contracts). After the report was published gold continued to decline at first. It seems likely that the net position of this group of traders subsequently went a bit further into net short territory. We want to stress here that we are definitely not arguing that it is always positive when speculators go net short in this market. Very long-term data clearly suggest otherwise – i.e., context is important. In this case, context is provided by the recent improvement in the gold sector’s relative strength against the metals and a likewise fairly recent minor shift in macroeconomic fundamentals, which look now slightly more favorable for gold than previously. As the chart illustrates, the net speculative position is also increasingly diverging from prices this year, after having tracked them fairly closely from Q3 2015 until Q4 2017. Clearly this market is now potentially quite susceptible to a change in perceptions. In the next missive we will discuss the change in macroeconomic fundamentals alluded to above and also take a brief look at gold vs. real interest rates and inflation. |
Managed Money 2015-2018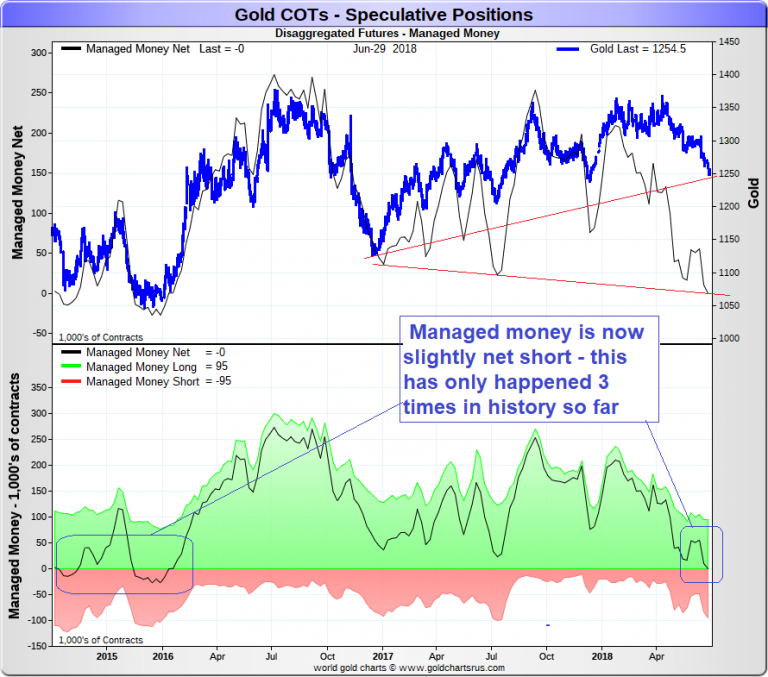 - Click to enlarge The “managed money” category in COMEX gold futures. Top panel: net position (black line) vs. the gold price; bottom panel: net position (black line) as well as gross short and gross long position (red and green areas). The red lines in the top panel illustrate that another significant divergence has emerged, in this case between net speculative positioning and price. |
Charts by: StockCharts, goldchartrus.com.
Full story here Are you the author?
Tags: Chart Update,newslettersent,Precious Metals